
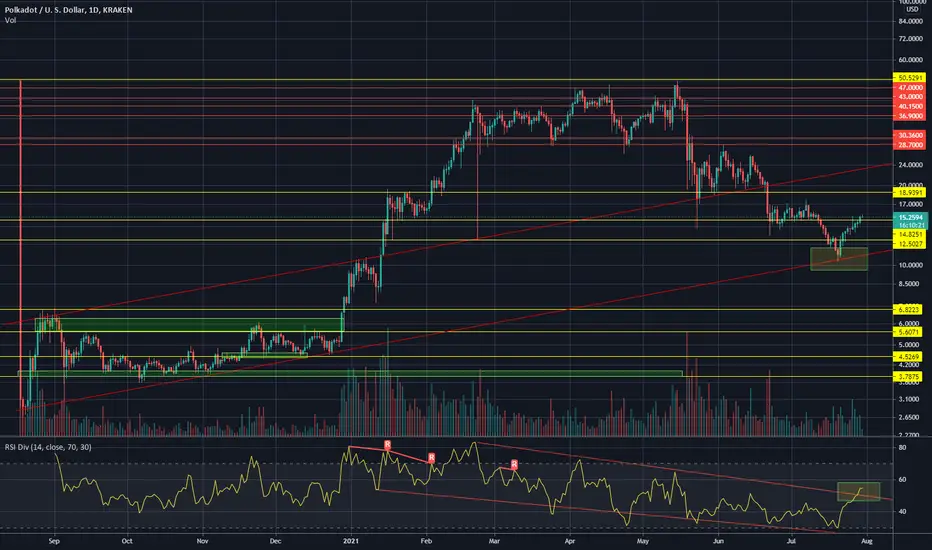
I think DOT completed the correction when it has returned to bottom of the long-term trend line at $10.5. The bounce was followed by increased volume which is indicator buyers took over control. RSI is stepping up and has moved beyond 50 level. Chart is looking good and every price that is close to support trendline (red line) is good buy (NFA). If Bitcoin stay stable and continue to rally, DOT should move up in price as well and return to ATH and beyond.
On a Weekly time frame DOT closed as bullish hammer which is very positive sign. Over the weekend monthly candle will be formed which will be important indicator for future price development.
On a Weekly time frame DOT closed as bullish hammer which is very positive sign. Over the weekend monthly candle will be formed which will be important indicator for future price development.

면책사항
해당 정보와 게시물은 금융, 투자, 트레이딩 또는 기타 유형의 조언이나 권장 사항으로 간주되지 않으며, 트레이딩뷰에서 제공하거나 보증하는 것이 아닙니다. 자세한 내용은 이용 약관을 참조하세요.
면책사항
해당 정보와 게시물은 금융, 투자, 트레이딩 또는 기타 유형의 조언이나 권장 사항으로 간주되지 않으며, 트레이딩뷰에서 제공하거나 보증하는 것이 아닙니다. 자세한 내용은 이용 약관을 참조하세요.