
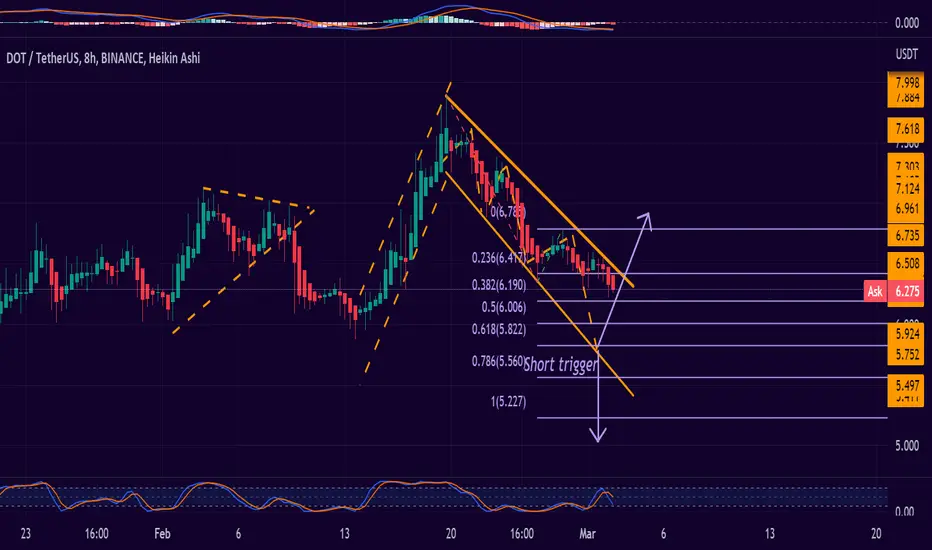
DOTUSDT 8H
The DOT USDT chart in an 8-hour period continues to indicate the bearish channel. It could break the upward channel and leave this bearish trend, but if it drops from the level of 5,833 then we will have a SHORT TRIGGER, that is a trigger for the shorts.
On the M45 chart, we will see the supports and resistances:
DOTUSDT M45:
S1:6,215
S2: 6,145
R1: 6,331
R2: 6,356
The DOT USDT chart in an 8-hour period continues to indicate the bearish channel. It could break the upward channel and leave this bearish trend, but if it drops from the level of 5,833 then we will have a SHORT TRIGGER, that is a trigger for the shorts.
On the M45 chart, we will see the supports and resistances:
DOTUSDT M45:
S1:6,215
S2: 6,145
R1: 6,331
R2: 6,356

Renato Ulianov | Market Analysis & Trading
YouTube: youtube.com/@TradewithRenatoUlianov
Disclaimer: All content is for educational and informational purposes only and does not constitute financial advice.
YouTube: youtube.com/@TradewithRenatoUlianov
Disclaimer: All content is for educational and informational purposes only and does not constitute financial advice.
면책사항
해당 정보와 게시물은 금융, 투자, 트레이딩 또는 기타 유형의 조언이나 권장 사항으로 간주되지 않으며, 트레이딩뷰에서 제공하거나 보증하는 것이 아닙니다. 자세한 내용은 이용 약관을 참조하세요.
Renato Ulianov | Market Analysis & Trading
YouTube: youtube.com/@TradewithRenatoUlianov
Disclaimer: All content is for educational and informational purposes only and does not constitute financial advice.
YouTube: youtube.com/@TradewithRenatoUlianov
Disclaimer: All content is for educational and informational purposes only and does not constitute financial advice.
면책사항
해당 정보와 게시물은 금융, 투자, 트레이딩 또는 기타 유형의 조언이나 권장 사항으로 간주되지 않으며, 트레이딩뷰에서 제공하거나 보증하는 것이 아닙니다. 자세한 내용은 이용 약관을 참조하세요.