
hi traders,
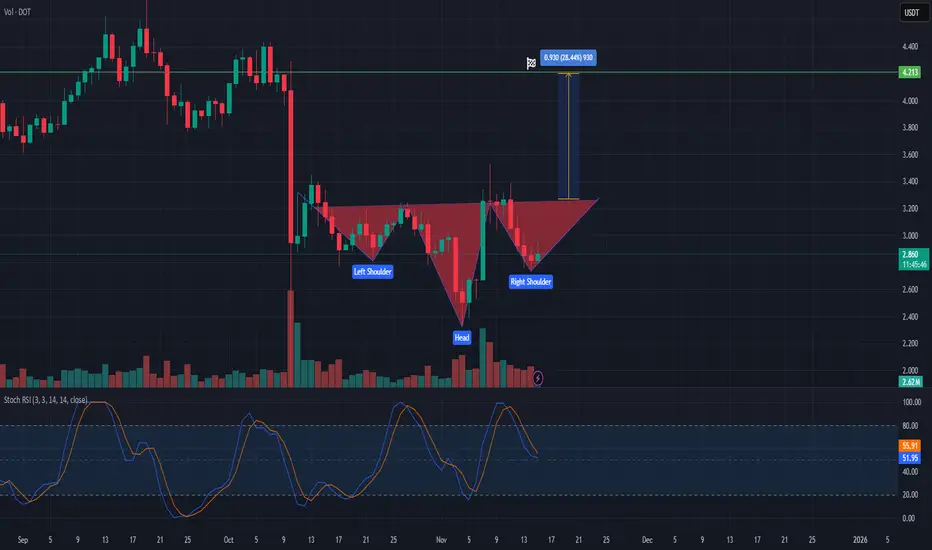
DOT is currently forming a bullish inverted head and shoulders pattern on the daily chart, suggesting a potential medium-term trend reversal to the upside.
Left Shoulder: Price declines and rebounds, creating the first swing low.
Head: A deeper sell-off forms the lowest point of the structure before buyers step back in.
Right Shoulder: Price is now developing the right shoulder, with higher lows indicating strengthening bullish momentum.
The neckline resistance sits slightly above the current price. A confirmed daily close above the neckline would complete the pattern and trigger a potential breakout.
The projected target, measured from the head to the neckline and extended upward from the breakout point, suggests an approximate 28% upside move, with the target area around 4.21 USDT.
The Stochastic RSI is currently in mid-range and curling upward, providing additional momentum support for a potential bullish breakout.
Trading Plan Considerations:
Entry: Upon a decisive breakout and daily close above the neckline.
Target: ~4.21 USDT (pattern completion target).
Invalidation: Breakdown below the right shoulder low would invalidate this setup.
DOT is currently forming a bullish inverted head and shoulders pattern on the daily chart, suggesting a potential medium-term trend reversal to the upside.
Left Shoulder: Price declines and rebounds, creating the first swing low.
Head: A deeper sell-off forms the lowest point of the structure before buyers step back in.
Right Shoulder: Price is now developing the right shoulder, with higher lows indicating strengthening bullish momentum.
The neckline resistance sits slightly above the current price. A confirmed daily close above the neckline would complete the pattern and trigger a potential breakout.
The projected target, measured from the head to the neckline and extended upward from the breakout point, suggests an approximate 28% upside move, with the target area around 4.21 USDT.
The Stochastic RSI is currently in mid-range and curling upward, providing additional momentum support for a potential bullish breakout.
Trading Plan Considerations:
Entry: Upon a decisive breakout and daily close above the neckline.
Target: ~4.21 USDT (pattern completion target).
Invalidation: Breakdown below the right shoulder low would invalidate this setup.

💥 Free signals and ideas ➡ t.me/vfinvestment
면책사항
해당 정보와 게시물은 금융, 투자, 트레이딩 또는 기타 유형의 조언이나 권장 사항으로 간주되지 않으며, 트레이딩뷰에서 제공하거나 보증하는 것이 아닙니다. 자세한 내용은 이용 약관을 참조하세요.
💥 Free signals and ideas ➡ t.me/vfinvestment
면책사항
해당 정보와 게시물은 금융, 투자, 트레이딩 또는 기타 유형의 조언이나 권장 사항으로 간주되지 않으며, 트레이딩뷰에서 제공하거나 보증하는 것이 아닙니다. 자세한 내용은 이용 약관을 참조하세요.