
Hey Everyone,
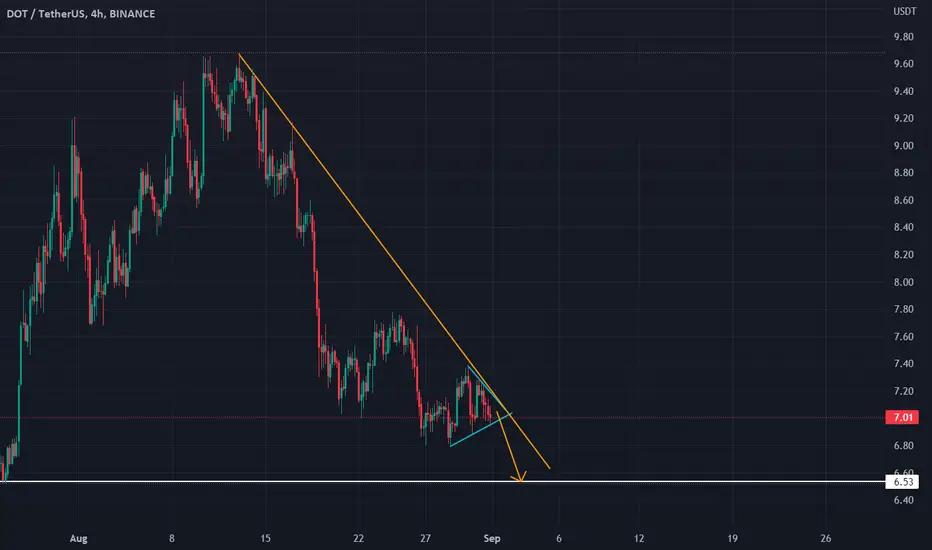
DOTUSDT still looks bearish to me, in the short term mostly as I explained in my last post about ETHUSDT. (link down below)
In the last few days, the market has been consolidating without any swings that we used to see before. The mid-term trend is bearish, and we are in a symmetrical triangle right now. At its support precisely. We are most likely going to reach the next major Support (in white).

However, looking at the long-term chart here and the MA plotted on the RSI, I saw that the RSI reading had crossed the RSI MA, and it is now retesting it. Usually, RSI MA works as the usual moving average but on a momentum indicator. This is a super-bullish factor for me, but still, this is in the long term. So, until we see an opportunity to enter a bullish market, this might take from week(s), to month(s) but probably before the end of this year.

I have also noticed this pattern on multiple big-cap coins like VETUSDT and ETHUSDT.


DOTUSDT still looks bearish to me, in the short term mostly as I explained in my last post about ETHUSDT. (link down below)
In the last few days, the market has been consolidating without any swings that we used to see before. The mid-term trend is bearish, and we are in a symmetrical triangle right now. At its support precisely. We are most likely going to reach the next major Support (in white).
However, looking at the long-term chart here and the MA plotted on the RSI, I saw that the RSI reading had crossed the RSI MA, and it is now retesting it. Usually, RSI MA works as the usual moving average but on a momentum indicator. This is a super-bullish factor for me, but still, this is in the long term. So, until we see an opportunity to enter a bullish market, this might take from week(s), to month(s) but probably before the end of this year.
I have also noticed this pattern on multiple big-cap coins like VETUSDT and ETHUSDT.

관련 발행물
면책사항
해당 정보와 게시물은 금융, 투자, 트레이딩 또는 기타 유형의 조언이나 권장 사항으로 간주되지 않으며, 트레이딩뷰에서 제공하거나 보증하는 것이 아닙니다. 자세한 내용은 이용 약관을 참조하세요.
면책사항
해당 정보와 게시물은 금융, 투자, 트레이딩 또는 기타 유형의 조언이나 권장 사항으로 간주되지 않으며, 트레이딩뷰에서 제공하거나 보증하는 것이 아닙니다. 자세한 내용은 이용 약관을 참조하세요.