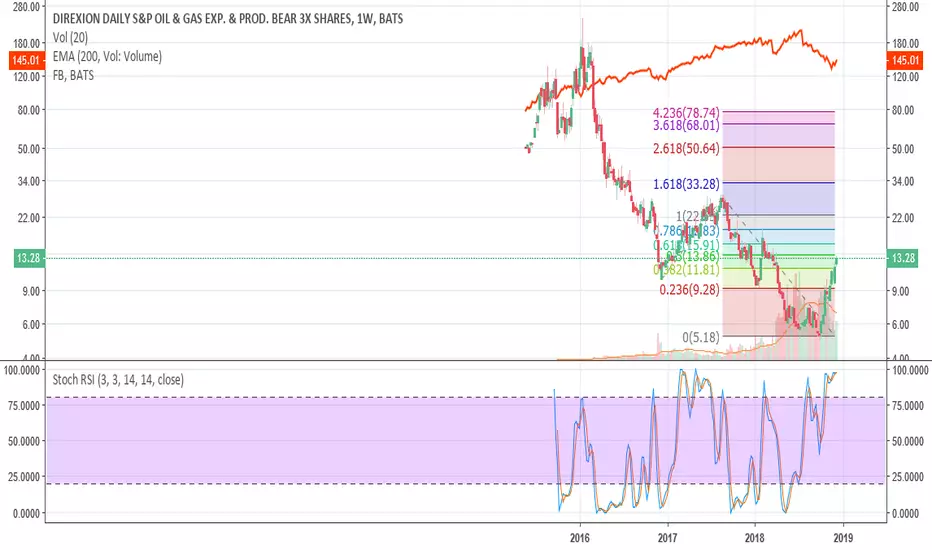
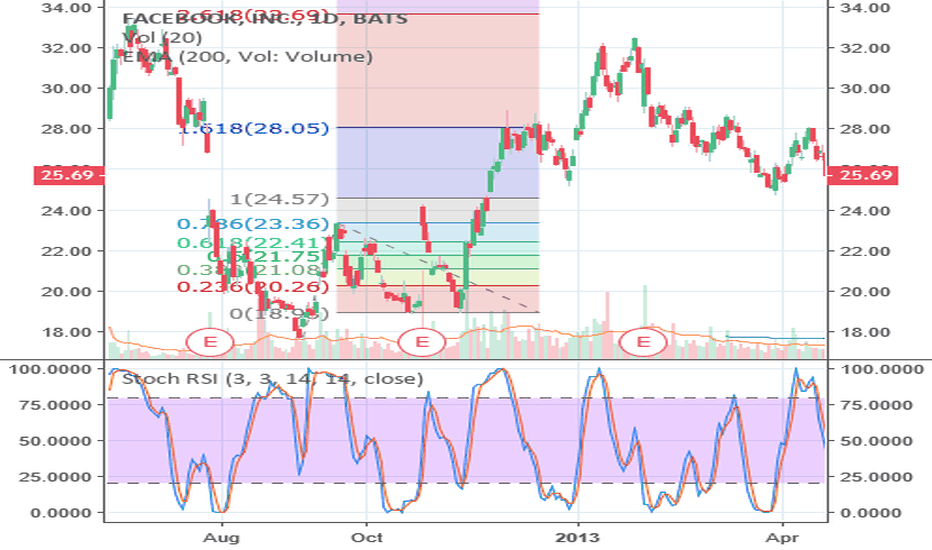
Please see attached similarities between RSI and market movements in early 2013 IPO of Facebook  FB, and early market movements of $DRIP. I see long term weakness in S&P500, till mid 2019 at least. Oil is going lower too.
I can see $30 DRIP by mid-January, and $68 DRIP by March to June. But this could go back to IPO too, but that will take much longer, (5-10 years).
Could be wrong, invest at your own risk. I'm just some guy on the internet.
FB, and early market movements of $DRIP. I see long term weakness in S&P500, till mid 2019 at least. Oil is going lower too.I can see $30
DRIP by mid-January, and $68 DRIP by March to June. But this could go back to IPO too, but that will take much longer, (5-10 years).Could be wrong, invest at your own risk. I'm just some guy on the internet.
액티브 트레이드
노트
Trade still active. Aproaching $16 resistance, possible minor correction here, next target ~$19.액티브 트레이드
We are approaching my TP of 19, broke through $16 with a little resistance as expected. I expect the graph to meet great resistance at 19-22 range.노트
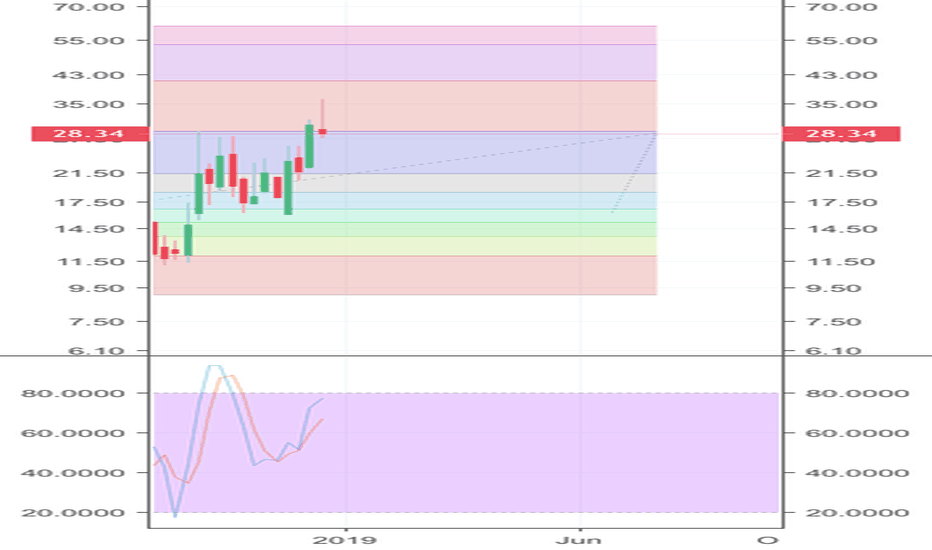
Consolidating for next rise to ~$33 Fibonacci level. We could hit this in the next two weeks, no later than February 1st.Please see my VIX chart for further details:

관련 발행물
면책사항
해당 정보와 게시물은 금융, 투자, 트레이딩 또는 기타 유형의 조언이나 권장 사항으로 간주되지 않으며, 트레이딩뷰에서 제공하거나 보증하는 것이 아닙니다. 자세한 내용은 이용 약관을 참조하세요.
면책사항
해당 정보와 게시물은 금융, 투자, 트레이딩 또는 기타 유형의 조언이나 권장 사항으로 간주되지 않으며, 트레이딩뷰에서 제공하거나 보증하는 것이 아닙니다. 자세한 내용은 이용 약관을 참조하세요.