
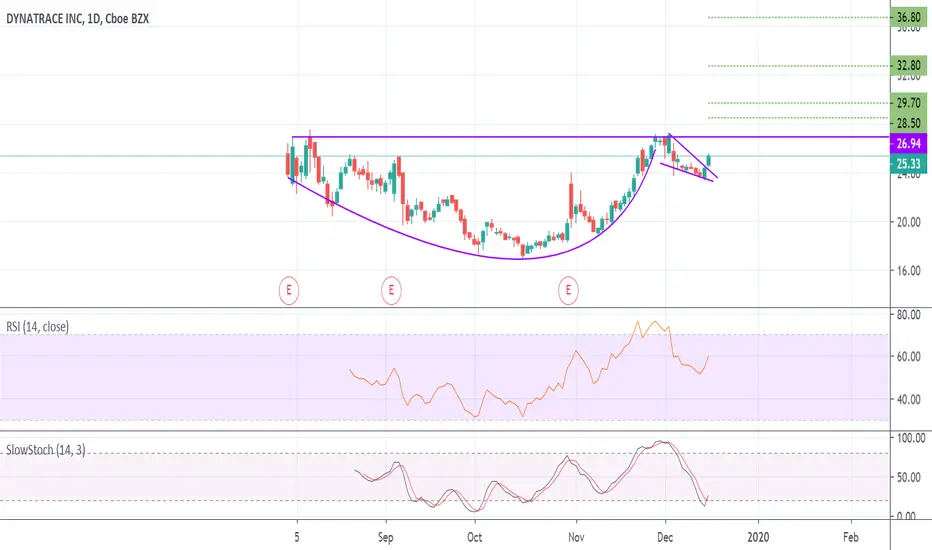
Dynatrace has not been actively traded for very long but the daily chart has created a cup & handle pattern which just needs a breakout for confirmation. The backside of the pattern can be interpreted as a bull flag that would have broken out during today's trading session. Notice how the RSI held the 50 level as well as the stock exits an oversold condition. The Sector, Industry, & stock all have relative strength against the SPX as well.
My first two price targets that are noted on the chart are Fibonacci extension levels. The third target is based on the bull flag breakout while the fourth target would be if we receive confirmation of the cup & handle breakout.
My first two price targets that are noted on the chart are Fibonacci extension levels. The third target is based on the bull flag breakout while the fourth target would be if we receive confirmation of the cup & handle breakout.

면책사항
해당 정보와 게시물은 금융, 투자, 트레이딩 또는 기타 유형의 조언이나 권장 사항으로 간주되지 않으며, 트레이딩뷰에서 제공하거나 보증하는 것이 아닙니다. 자세한 내용은 이용 약관을 참조하세요.
면책사항
해당 정보와 게시물은 금융, 투자, 트레이딩 또는 기타 유형의 조언이나 권장 사항으로 간주되지 않으며, 트레이딩뷰에서 제공하거나 보증하는 것이 아닙니다. 자세한 내용은 이용 약관을 참조하세요.