
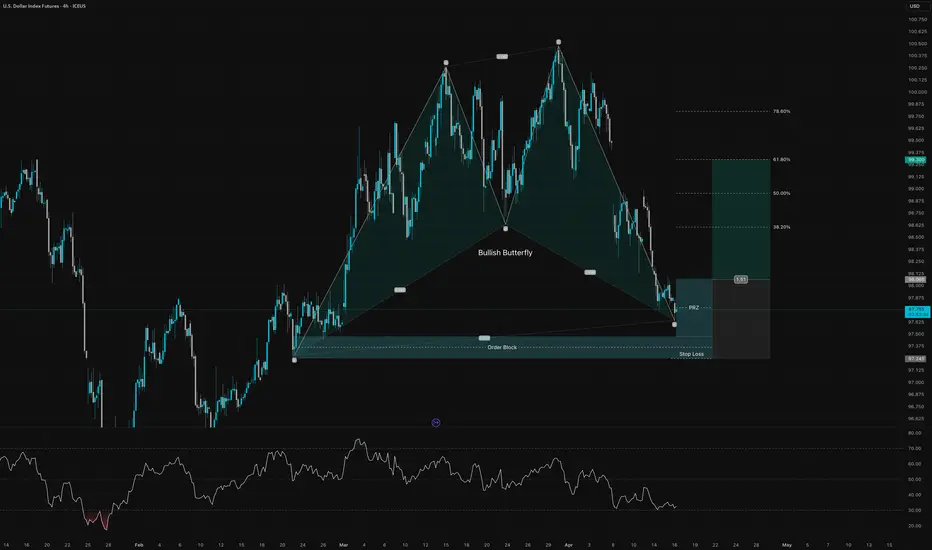
On the 4H chart, U.S. Dollar Index Futures are approaching a technically important reaction zone after completing a Bullish Butterfly harmonic pattern. The pattern terminates inside a well-defined PRZ (Potential Reversal Zone) around the 97.60–97.25 area, which also overlaps with a prior order block. This confluence makes the current region highly relevant for a possible bullish reaction.
After the strong selloff from the recent highs, price has now reached a zone where downside momentum may start to fade. In addition, RSI is trading in a weak area, suggesting the market is already stretched on the downside. That does not guarantee an immediate reversal, but it does support the idea that sellers may be losing momentum near support.
As long as price holds above the lower boundary of the PRZ and the stop-loss area around 97.25, a recovery move toward the next Fibonacci retracement levels becomes increasingly likely. The first upside targets are located near the 38.2% retracement, followed by the 50.0% and 61.8% levels, with the latter sitting around 99.30 and acting as the main bullish target in this setup.
The bullish idea would be invalidated by a clear break below the PRZ and stop-loss zone, as that would suggest the harmonic support has failed and sellers remain in full control.
Overall, this is a countertrend bullish setup inside a larger bearish move, so confirmation through price action is important. If buyers defend the PRZ, the chart offers an attractive rebound opportunity with a favorable risk-to-reward structure.
After the strong selloff from the recent highs, price has now reached a zone where downside momentum may start to fade. In addition, RSI is trading in a weak area, suggesting the market is already stretched on the downside. That does not guarantee an immediate reversal, but it does support the idea that sellers may be losing momentum near support.
As long as price holds above the lower boundary of the PRZ and the stop-loss area around 97.25, a recovery move toward the next Fibonacci retracement levels becomes increasingly likely. The first upside targets are located near the 38.2% retracement, followed by the 50.0% and 61.8% levels, with the latter sitting around 99.30 and acting as the main bullish target in this setup.
The bullish idea would be invalidated by a clear break below the PRZ and stop-loss zone, as that would suggest the harmonic support has failed and sellers remain in full control.
Overall, this is a countertrend bullish setup inside a larger bearish move, so confirmation through price action is important. If buyers defend the PRZ, the chart offers an attractive rebound opportunity with a favorable risk-to-reward structure.
액티브 트레이드
거래청산: 타겟 닿음
Take Profit 1 reached
면책사항
해당 정보와 게시물은 금융, 투자, 트레이딩 또는 기타 유형의 조언이나 권장 사항으로 간주되지 않으며, 트레이딩뷰에서 제공하거나 보증하는 것이 아닙니다. 자세한 내용은 이용 약관을 참조하세요.
면책사항
해당 정보와 게시물은 금융, 투자, 트레이딩 또는 기타 유형의 조언이나 권장 사항으로 간주되지 않으며, 트레이딩뷰에서 제공하거나 보증하는 것이 아닙니다. 자세한 내용은 이용 약관을 참조하세요.