
Hi Traders!
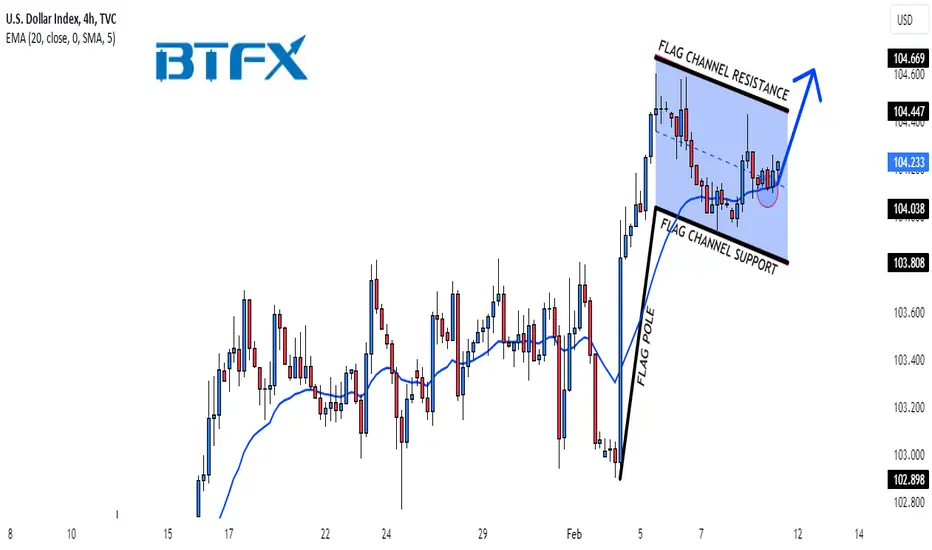
There is a bull flag pattern developed on the DXY 4H chart.
Here are the details:
The price action looks bullish, and the market looks like it is about to complete the consolidation phase in the flag's channel as the flag pattern is in its late stages.
The market is still above the 20 EMA, which is a bullish signal. As long as the market remains above the EMA and flag channel support, our view will remain bullish.
Preferred Direction: Buy
Resistance (FLAG CHANNEL): 104.669
Support (FLAG CHANNEL): 103.808
Technical Indicators: 20 EMA
Please make sure to click on the like/boost button 🚀 as your support greatly helps.
Trade safely and responsibly.
BluetonaFX
There is a bull flag pattern developed on the DXY 4H chart.
Here are the details:
The price action looks bullish, and the market looks like it is about to complete the consolidation phase in the flag's channel as the flag pattern is in its late stages.
The market is still above the 20 EMA, which is a bullish signal. As long as the market remains above the EMA and flag channel support, our view will remain bullish.
Preferred Direction: Buy
Resistance (FLAG CHANNEL): 104.669
Support (FLAG CHANNEL): 103.808
Technical Indicators: 20 EMA
Please make sure to click on the like/boost button 🚀 as your support greatly helps.
Trade safely and responsibly.
BluetonaFX
노트
Flag complete
면책사항
해당 정보와 게시물은 금융, 투자, 트레이딩 또는 기타 유형의 조언이나 권장 사항으로 간주되지 않으며, 트레이딩뷰에서 제공하거나 보증하는 것이 아닙니다. 자세한 내용은 이용 약관을 참조하세요.
면책사항
해당 정보와 게시물은 금융, 투자, 트레이딩 또는 기타 유형의 조언이나 권장 사항으로 간주되지 않으며, 트레이딩뷰에서 제공하거나 보증하는 것이 아닙니다. 자세한 내용은 이용 약관을 참조하세요.