
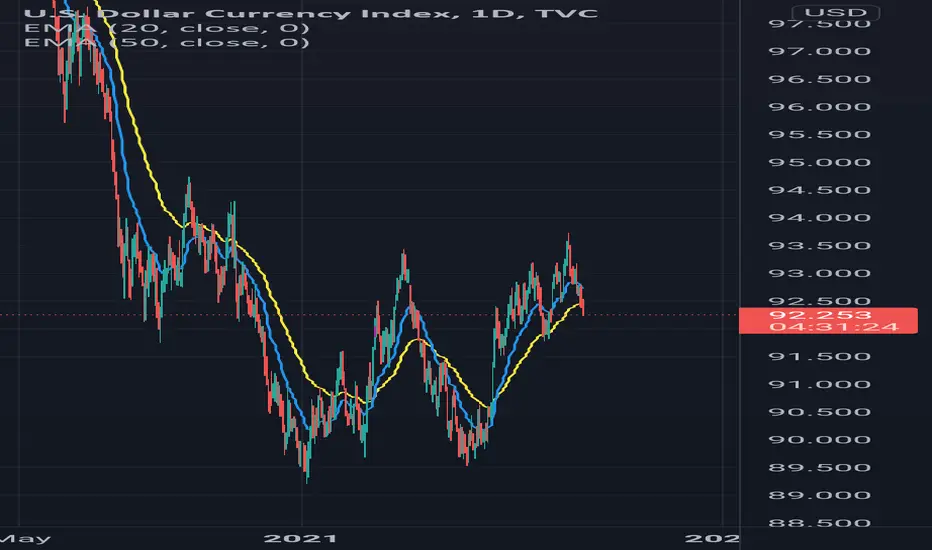
Time Frame: Daily candle
Indicators: 50 EMA
Line: Horizontal ( neck line)
Price Action is more accurate on big time frame. & Market always sustain around neck line. If it breaks with good strength we can see upside trend. So bullish on DXY.
Cadle is also taking support at 50 EMA.
Indicators: 50 EMA
Line: Horizontal ( neck line)
Price Action is more accurate on big time frame. & Market always sustain around neck line. If it breaks with good strength we can see upside trend. So bullish on DXY.
Cadle is also taking support at 50 EMA.

면책사항
해당 정보와 게시물은 금융, 투자, 트레이딩 또는 기타 유형의 조언이나 권장 사항으로 간주되지 않으며, 트레이딩뷰에서 제공하거나 보증하는 것이 아닙니다. 자세한 내용은 이용 약관을 참조하세요.
면책사항
해당 정보와 게시물은 금융, 투자, 트레이딩 또는 기타 유형의 조언이나 권장 사항으로 간주되지 않으며, 트레이딩뷰에서 제공하거나 보증하는 것이 아닙니다. 자세한 내용은 이용 약관을 참조하세요.