
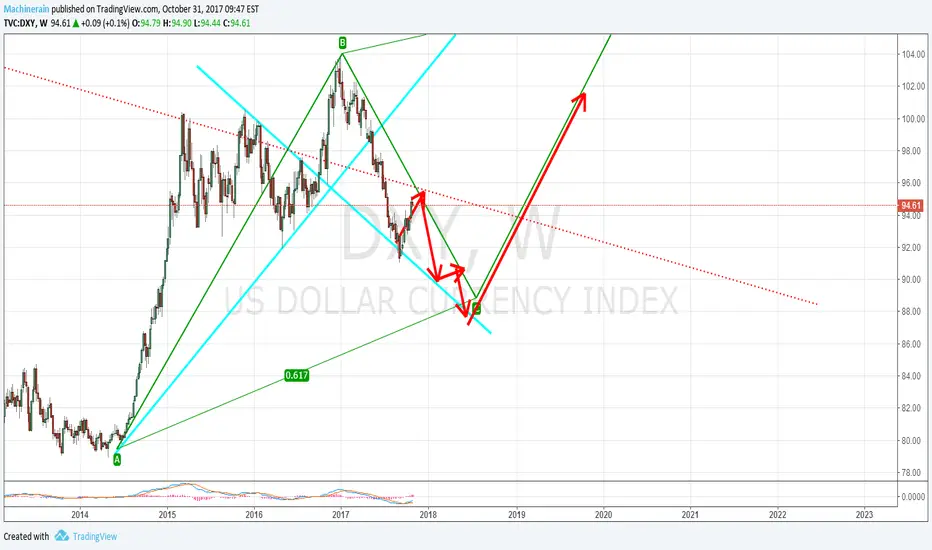
As we were looking for decline on the DXY 0.10% , bulls took over control. Here we go with my weekly analysis on the U.S. Dollar Index ;
A (orange)(closed) : Price clearly bounced on our bullish trendline . Blue area as been broken in the beginning of the week, my bearish bias was completely canceled. No break and no resistance, this direction bias is now closed.
A (blue) : Previously our plan C, I see the DXY 0.10% showing some significant strength signs;
Blue area as been broken which was our resistance. Next area to watch for a break through is the yellow one.
Price bounced on the bullish trendline .
A nice reverse head and shoulder is forming, looking for a break of the neckline.
Price found support right at the retest level after the trend line breakout, red area.
Support found on both 50(aqua) and 200(gray) exponential moving averages after a bullish crossover.
A nice regular bullish divergence also indicates a nice trend reversal, highlighted by the purple arrows on data and indicator window.
Target is 96.00, optimal trade entry area for shorting.
B (red) : Fake bullish move to the yellow area and by dropping back resulting as a price ranging.
Only price action can determine those bias, even none of them could occur.
Bias as changed for now but still bearish overall, I am currently looking for bullish move on this index, driving all USD based pairs.
Dollar strengh = USDXXX UP / XXXUSD DOWN
Dollar weak = XXXUSD UP / USDXXX DOWN

관련 발행물
면책사항
해당 정보와 게시물은 금융, 투자, 트레이딩 또는 기타 유형의 조언이나 권장 사항으로 간주되지 않으며, 트레이딩뷰에서 제공하거나 보증하는 것이 아닙니다. 자세한 내용은 이용 약관을 참조하세요.
관련 발행물
면책사항
해당 정보와 게시물은 금융, 투자, 트레이딩 또는 기타 유형의 조언이나 권장 사항으로 간주되지 않으며, 트레이딩뷰에서 제공하거나 보증하는 것이 아닙니다. 자세한 내용은 이용 약관을 참조하세요.