
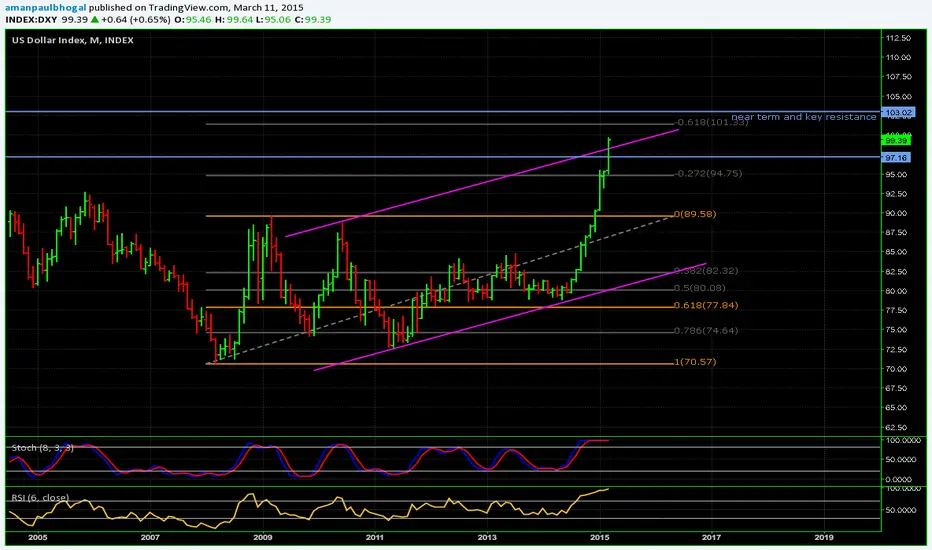
On the monthly chart, the US Dollar Index has soared without a pull back since May 2014 leaving questions for a possible future retracement. Approaching the 1.618 Fibonacci extension (~101) and previous key resistance at 103 is a price region where the effect on price action behaviour will be of significant interest from a technical perspective to witness a potential pullback. Until then, Dixie continues to cycle offering short to medium-term long opportunities on the daily time frame.

면책사항
해당 정보와 게시물은 금융, 투자, 트레이딩 또는 기타 유형의 조언이나 권장 사항으로 간주되지 않으며, 트레이딩뷰에서 제공하거나 보증하는 것이 아닙니다. 자세한 내용은 이용 약관을 참조하세요.
면책사항
해당 정보와 게시물은 금융, 투자, 트레이딩 또는 기타 유형의 조언이나 권장 사항으로 간주되지 않으며, 트레이딩뷰에서 제공하거나 보증하는 것이 아닙니다. 자세한 내용은 이용 약관을 참조하세요.