
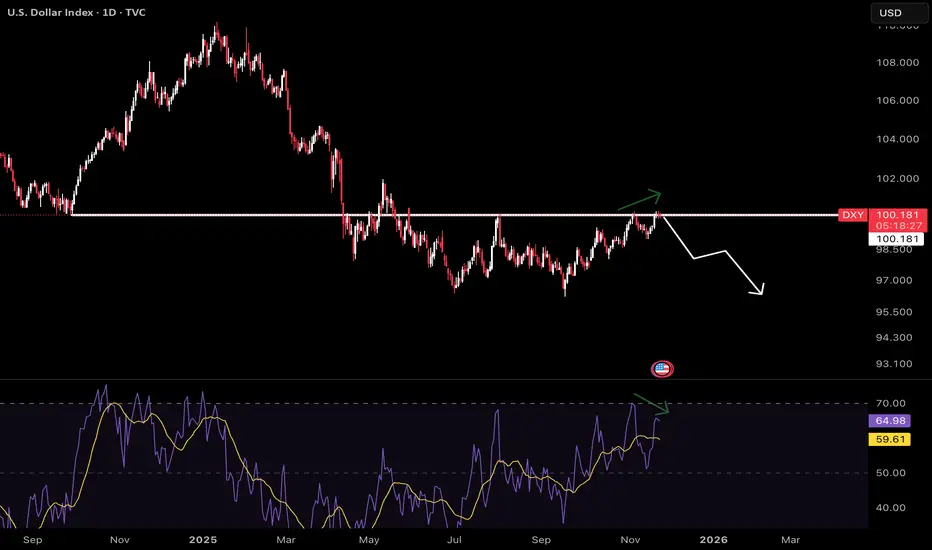
- This chart tracks the daily price of DXY , revealing key technical and macro dynamics relevant for traders and investors in risk-on markets.
- The DXY has approached a major horizontal resistance level near 100.2, a zone that previously acted as both support and resistance.
- While price tests this resistance, the RSI shows a classic bearish divergence, DXY has made higher highs on price, but RSI has failed to confirm new momentum highs. This gap signals underlying exhaustion, suggesting that further upside for the dollar may be limited in the near term.
- A falling DXY signals easier liquidity and can catalyze rallies in riskier asset classes. Traders often watch DXY movements for clues on when to deploy capital into stocks or crypto.
액티브 트레이드
DXY rejected the resistance zone presented earlier. This confirms:
Bearish divergence is playing out as expected
Sellers stepped in at the key resistance level
Lower highs forming on price while RSI shows lower highs = confirmed downtrend
Next support zone now becomes key. Watch for reversal or breakdown confirmation
Risk assets (BTC, altcoins) likely to benefit from weakening dollar structure

면책사항
해당 정보와 게시물은 금융, 투자, 트레이딩 또는 기타 유형의 조언이나 권장 사항으로 간주되지 않으며, 트레이딩뷰에서 제공하거나 보증하는 것이 아닙니다. 자세한 내용은 이용 약관을 참조하세요.
면책사항
해당 정보와 게시물은 금융, 투자, 트레이딩 또는 기타 유형의 조언이나 권장 사항으로 간주되지 않으며, 트레이딩뷰에서 제공하거나 보증하는 것이 아닙니다. 자세한 내용은 이용 약관을 참조하세요.