
Monday, September 10, 2023
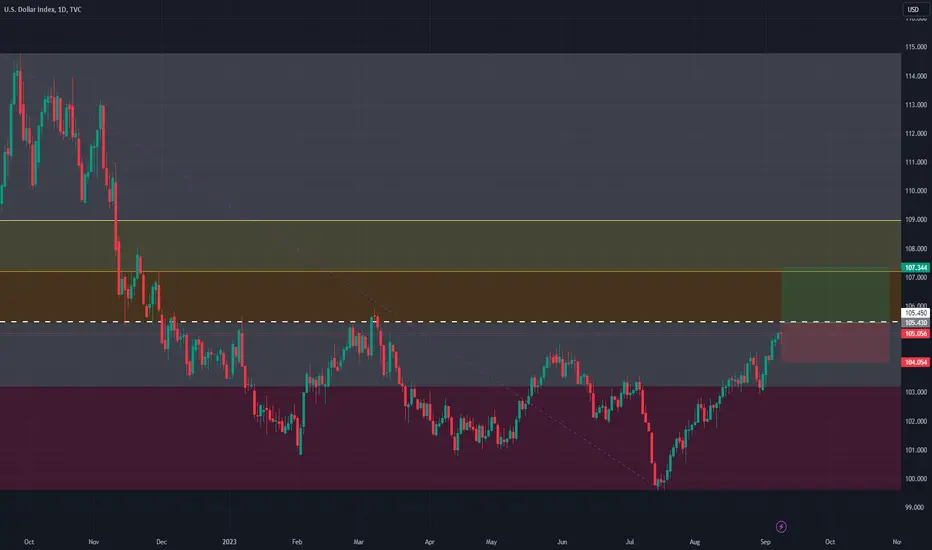
In the weekly chart of the US #Dollar Index, the market structure appears #bullish. Recently, the market found support around the 104 level, and the Dollar #Index has reached the 38.2% Fibonacci retracement level as part of a corrective move.
In this week's trading, if the current #uptrend continues, and the 38.2% resistance level at 105.45 is #broken, the market may find a clear path towards the 50% Fibonacci #retracement at the 107 level.
However, if the #resistance zone at 105.45 holds its ground, the #upward #momentum in the market may be limited, and the Dollar Index could return to the 104 #support level, marking a 23.6% #Fibonacci #retracement #correction.
So based on this analysis I suggests a bullish outlook for the Dollar Index.

면책사항
해당 정보와 게시물은 금융, 투자, 트레이딩 또는 기타 유형의 조언이나 권장 사항으로 간주되지 않으며, 트레이딩뷰에서 제공하거나 보증하는 것이 아닙니다. 자세한 내용은 이용 약관을 참조하세요.
면책사항
해당 정보와 게시물은 금융, 투자, 트레이딩 또는 기타 유형의 조언이나 권장 사항으로 간주되지 않으며, 트레이딩뷰에서 제공하거나 보증하는 것이 아닙니다. 자세한 내용은 이용 약관을 참조하세요.