
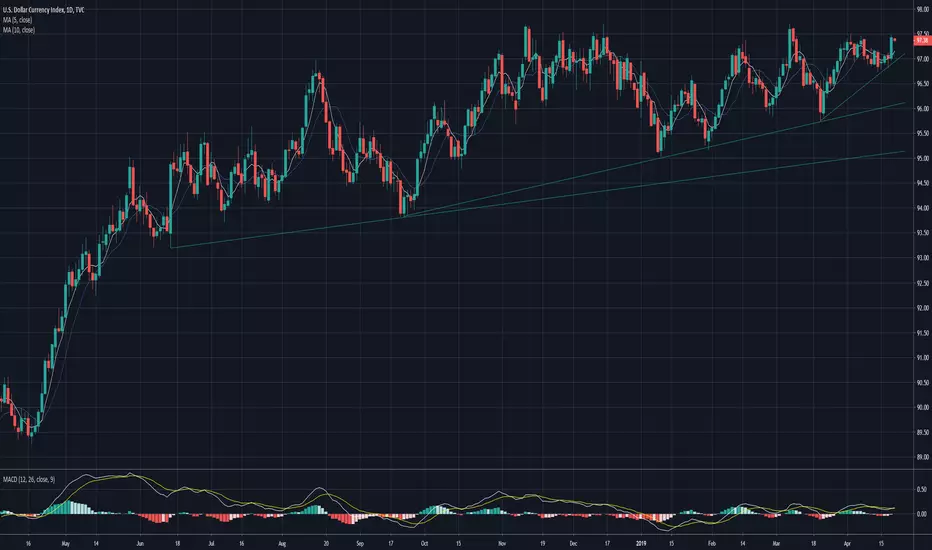
It's my 1st time to have DXY analysis, I start from longer time frame to short time frame sequences.
1M chart:

For long run, DXY will approach and breakthrough 103.82 which was set Jan. 2017.
1W chart:

In middle term, DXY stuck in a pivot area 95~98 for past 10 months. It may continue 1~3 months oscillation before break through resistance 98.
1D chart:

Though it likely continues oscillate within 95~98 pivot area on 1W chart. It shows upward trend on 1D chart. Another breakthrough attempt is already on the way.
4H chart:

It's obvious that up trend momentum remains strong in short term. And it's in a narrow pivot area 96.8~97.5. After pivot area mature, Price may lift to meet 98 resistance.
In conclusion, short term trade, I'd make limited order Long at price 96.8, SL:96.5, TP:97.8
middle term, I still see it remians pivot area oscillation. So i'd make limited order to short at price 98, SL:98.3, TP:96.
That means, I may Long DXY after price breakthrogh 98.1
1M chart:
For long run, DXY will approach and breakthrough 103.82 which was set Jan. 2017.
1W chart:
In middle term, DXY stuck in a pivot area 95~98 for past 10 months. It may continue 1~3 months oscillation before break through resistance 98.
1D chart:
Though it likely continues oscillate within 95~98 pivot area on 1W chart. It shows upward trend on 1D chart. Another breakthrough attempt is already on the way.
4H chart:
It's obvious that up trend momentum remains strong in short term. And it's in a narrow pivot area 96.8~97.5. After pivot area mature, Price may lift to meet 98 resistance.
In conclusion, short term trade, I'd make limited order Long at price 96.8, SL:96.5, TP:97.8
middle term, I still see it remians pivot area oscillation. So i'd make limited order to short at price 98, SL:98.3, TP:96.
That means, I may Long DXY after price breakthrogh 98.1

면책사항
해당 정보와 게시물은 금융, 투자, 트레이딩 또는 기타 유형의 조언이나 권장 사항으로 간주되지 않으며, 트레이딩뷰에서 제공하거나 보증하는 것이 아닙니다. 자세한 내용은 이용 약관을 참조하세요.
면책사항
해당 정보와 게시물은 금융, 투자, 트레이딩 또는 기타 유형의 조언이나 권장 사항으로 간주되지 않으며, 트레이딩뷰에서 제공하거나 보증하는 것이 아닙니다. 자세한 내용은 이용 약관을 참조하세요.