
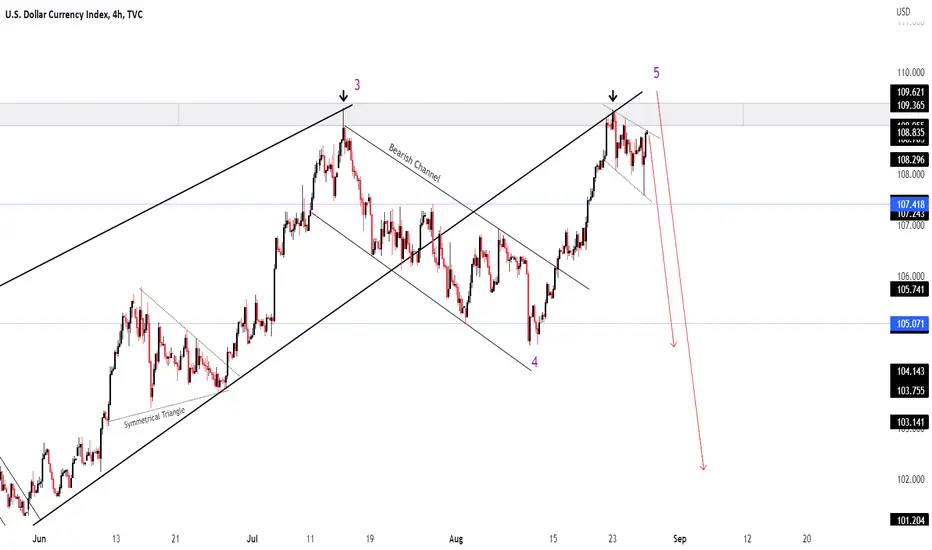
DXY - Dollar Technical Analysis Chart Update
Time Frame - H4
According Long Time Frame #LTF Daily we have RISING WEDGE pattern and it has Break out the Lower Trend Line and making its Retest
Another Pattern we have is Double Top if it rejects from the Current Level then its Possible that it will Follow Long Term Sel
Its currently standing at the Resistance Level Good Entry After Breakout or Rejection
In short time frame we have Bearish Channel and it is Currently Standing at the Upper Trend Line #UTL if it breaks out then its Buy
Another Reason for Buy is Elliot waves its Making Impulsive waves and it has Completed its " 3rd " corrective wave and now its Making " 4th " corrective wave and it can Follow Buy Trend
Its also has the Strong Selling Divergence in #RSI
Time Frame - H4
According Long Time Frame #LTF Daily we have RISING WEDGE pattern and it has Break out the Lower Trend Line and making its Retest
Another Pattern we have is Double Top if it rejects from the Current Level then its Possible that it will Follow Long Term Sel
Its currently standing at the Resistance Level Good Entry After Breakout or Rejection
In short time frame we have Bearish Channel and it is Currently Standing at the Upper Trend Line #UTL if it breaks out then its Buy
Another Reason for Buy is Elliot waves its Making Impulsive waves and it has Completed its " 3rd " corrective wave and now its Making " 4th " corrective wave and it can Follow Buy Trend
Its also has the Strong Selling Divergence in #RSI

면책사항
해당 정보와 게시물은 금융, 투자, 트레이딩 또는 기타 유형의 조언이나 권장 사항으로 간주되지 않으며, 트레이딩뷰에서 제공하거나 보증하는 것이 아닙니다. 자세한 내용은 이용 약관을 참조하세요.
면책사항
해당 정보와 게시물은 금융, 투자, 트레이딩 또는 기타 유형의 조언이나 권장 사항으로 간주되지 않으며, 트레이딩뷰에서 제공하거나 보증하는 것이 아닙니다. 자세한 내용은 이용 약관을 참조하세요.