
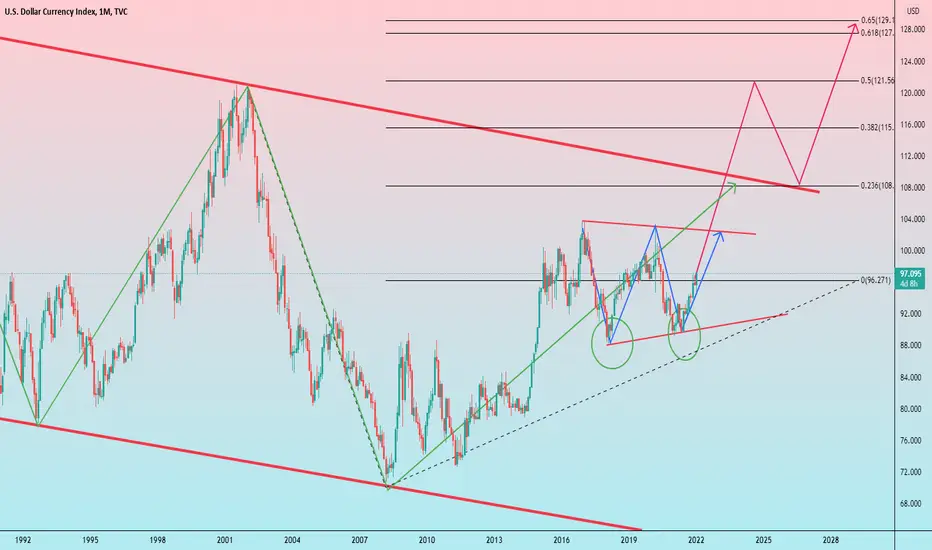
Today I am charting the The US Dollar Index (DXY) on a monthly chart over a multi-year period.
The chart shows a long term descending parallel channel (generally bullish), which the DXY has been trading in. Most recently it has broken a multi-year resistance zone, created through a double bottom pattern.
If the DXY breaks out of the descending parallel channel, we can see the price go up significantly as shown by the Fibonacci Extension (Trend-Based Fib Extension).
If the price gets rejected at the channel top, the price can go back down to as low as $60-65, which will create a triple bottom (generally bullish pattern).
This is a multi-year chart so don't expect everything to move quickly.
When zooming out, the US Dollar price looks very bullish in the long-term.
What are your opinions on this? I love reading your comments below.
Disclosure: This is just my opinion and not any type of financial advice. I enjoy charting and discussing technical analysis . Don't trade based on my advice. Do your own research! #cryptopickk
The chart shows a long term descending parallel channel (generally bullish), which the DXY has been trading in. Most recently it has broken a multi-year resistance zone, created through a double bottom pattern.
If the DXY breaks out of the descending parallel channel, we can see the price go up significantly as shown by the Fibonacci Extension (Trend-Based Fib Extension).
If the price gets rejected at the channel top, the price can go back down to as low as $60-65, which will create a triple bottom (generally bullish pattern).
This is a multi-year chart so don't expect everything to move quickly.
When zooming out, the US Dollar price looks very bullish in the long-term.
What are your opinions on this? I love reading your comments below.
Disclosure: This is just my opinion and not any type of financial advice. I enjoy charting and discussing technical analysis . Don't trade based on my advice. Do your own research! #cryptopickk

관련 발행물
면책사항
해당 정보와 게시물은 금융, 투자, 트레이딩 또는 기타 유형의 조언이나 권장 사항으로 간주되지 않으며, 트레이딩뷰에서 제공하거나 보증하는 것이 아닙니다. 자세한 내용은 이용 약관을 참조하세요.
관련 발행물
면책사항
해당 정보와 게시물은 금융, 투자, 트레이딩 또는 기타 유형의 조언이나 권장 사항으로 간주되지 않으며, 트레이딩뷰에서 제공하거나 보증하는 것이 아닙니다. 자세한 내용은 이용 약관을 참조하세요.