
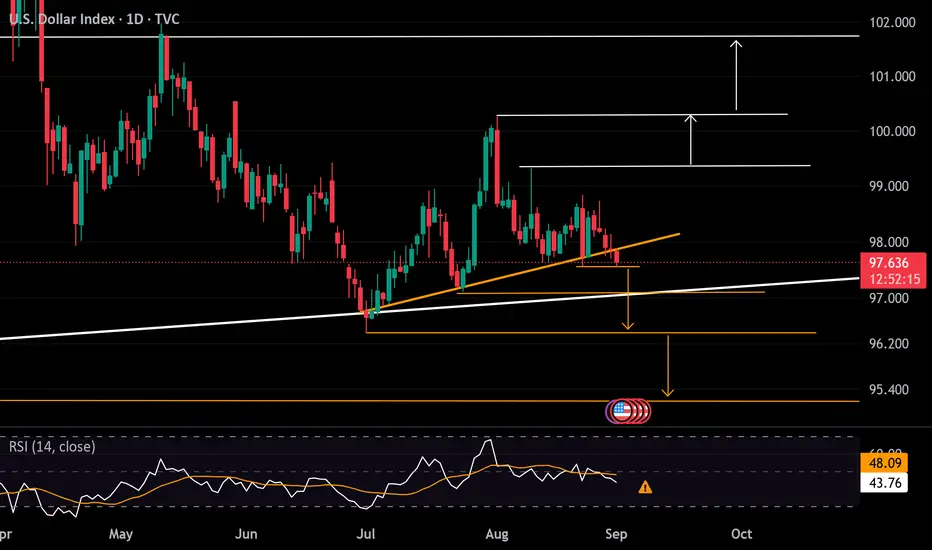
The DXY rebound between July and August has shaped a head and shoulders pattern. The chart is now testing the downside breakout, with the daily RSI turning bearish and slipping below the 50 level. A clean break below the 97.50 support could extend losses toward 97.20 and 96.50, with the full head and shoulders pattern pointing to a potential move down toward the 95.00–94.50 zone.
On the upside, a rebound above the 98.00 level would suggest some bullish recovery. However, a sustained move above 100.20 is needed to confidently shift the outlook toward a longer-term bullish reversal.
Key Events This Week
• ISM PMIs: to clarify US economic activity (Tuesday–Thursday)
• US NFPs and their impact on rate cut expectations and DXY price action (Friday)
• Effects of US trade and legal developments, EU political shifts, and Middle East escalations on risk sentiment
- Razan Hilal, CMT
On the upside, a rebound above the 98.00 level would suggest some bullish recovery. However, a sustained move above 100.20 is needed to confidently shift the outlook toward a longer-term bullish reversal.
Key Events This Week
• ISM PMIs: to clarify US economic activity (Tuesday–Thursday)
• US NFPs and their impact on rate cut expectations and DXY price action (Friday)
• Effects of US trade and legal developments, EU political shifts, and Middle East escalations on risk sentiment
- Razan Hilal, CMT

면책사항
해당 정보와 게시물은 금융, 투자, 트레이딩 또는 기타 유형의 조언이나 권장 사항으로 간주되지 않으며, 트레이딩뷰에서 제공하거나 보증하는 것이 아닙니다. 자세한 내용은 이용 약관을 참조하세요.
면책사항
해당 정보와 게시물은 금융, 투자, 트레이딩 또는 기타 유형의 조언이나 권장 사항으로 간주되지 않으며, 트레이딩뷰에서 제공하거나 보증하는 것이 아닙니다. 자세한 내용은 이용 약관을 참조하세요.