 DXY
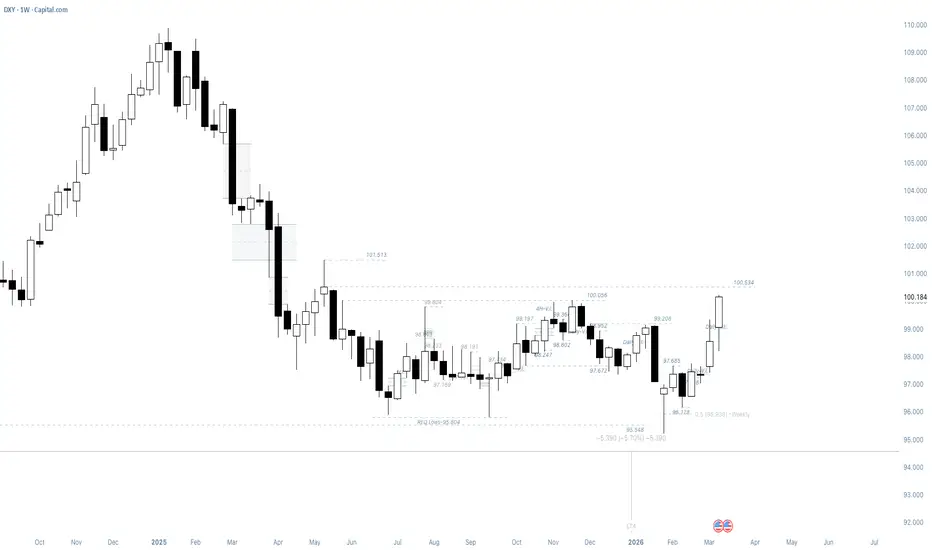
DXY The U.S. Dollar Index closed the week showing strength across multiple timeframes, suggesting the potential for continued upside expansion.
Weekly Structure
DXY closed bullish at 100.184, above the required level and the upper band of the value area (100.056).
This type of weekly close often indicates accumulation and continuation potential.
Observations:
• Bullish weekly close above key value level
• Several bullish gaps left below price
• Structure supporting continuation
These conditions suggest that buyers remain active and defending lower levels.
Daily Structure
The daily chart confirmed this strength with a clean close above 100.056.
This reinforces the bullish weekly structure.
Next upside objective
100.534
As long as price holds above the breakout level, continuation remains the expectation.
Lower Timeframe Context
Lower timeframes continue to support bullish order flow.
Short-term re-tracements could occur, but the broader structure favors continuation.
Weekly Expectation
Bullish continuation toward 100.534.
The early week behavior will help confirm whether momentum continues or pauses before the next expansion.
News to pay attention to:
Wed Mar 11 📕 8:30am Core CPI m/m
Thu Mar 12 📕 8:30am Unemployment Claims
Fri Mar 13 📕 8:30am Core PCE Price Index m/m
Fri Mar 13 📕 10:00am JOLTS Job Openings
액티브 트레이드
Correction on the News, Date and times-The ones provided before are from last weeks.Mon Mar 16 8:30am Empire State Manufacturing Index
Tue Mar 17 10:00am Pending Home Sales m/m
Wed Mar 18 📕8:30am Core PPI m/m
Wed Mar 18 📕2:00pm Federal Funds Rate
Wed Mar 18 📕2:30pm FOMC Press Conference
Thu Mar 19 📕8:30am Unemployment Claims
노트
Range of Week stablished노트
노트
There is a need to re assess...This is not Bullish
노트
Lets see if this plays out from here노트
Ok this is starting to take shape노트
Gave a much deeper retracement than expected노트
Lets GO!노트
노트
No saving this one주문취소됨

면책사항
해당 정보와 게시물은 금융, 투자, 트레이딩 또는 기타 유형의 조언이나 권장 사항으로 간주되지 않으며, 트레이딩뷰에서 제공하거나 보증하는 것이 아닙니다. 자세한 내용은 이용 약관을 참조하세요.
면책사항
해당 정보와 게시물은 금융, 투자, 트레이딩 또는 기타 유형의 조언이나 권장 사항으로 간주되지 않으며, 트레이딩뷰에서 제공하거나 보증하는 것이 아닙니다. 자세한 내용은 이용 약관을 참조하세요.