
Currently at an area where price congested and broke higher to start a 23-month bull run in 2018-19.
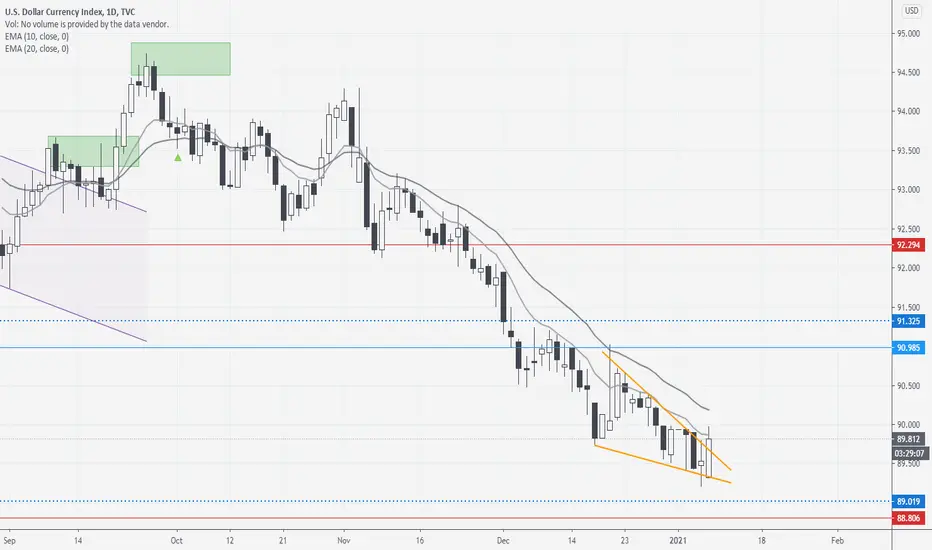
LTF is showing a possible bottom with the formation of a higher high and a breakout from this descending wedge pattern.
Likely to see some kind of trading range before any decisive bullish breakout/reversal but today's candle is pretty bullish and the bulls would be looking to close the day strong. Context is okay for reversal here so we shall see.
A bearish break below 89 invalidates this view.
Weekly chart:

LTF is showing a possible bottom with the formation of a higher high and a breakout from this descending wedge pattern.
Likely to see some kind of trading range before any decisive bullish breakout/reversal but today's candle is pretty bullish and the bulls would be looking to close the day strong. Context is okay for reversal here so we shall see.
A bearish break below 89 invalidates this view.
Weekly chart:

면책사항
해당 정보와 게시물은 금융, 투자, 트레이딩 또는 기타 유형의 조언이나 권장 사항으로 간주되지 않으며, 트레이딩뷰에서 제공하거나 보증하는 것이 아닙니다. 자세한 내용은 이용 약관을 참조하세요.
면책사항
해당 정보와 게시물은 금융, 투자, 트레이딩 또는 기타 유형의 조언이나 권장 사항으로 간주되지 않으며, 트레이딩뷰에서 제공하거나 보증하는 것이 아닙니다. 자세한 내용은 이용 약관을 참조하세요.