
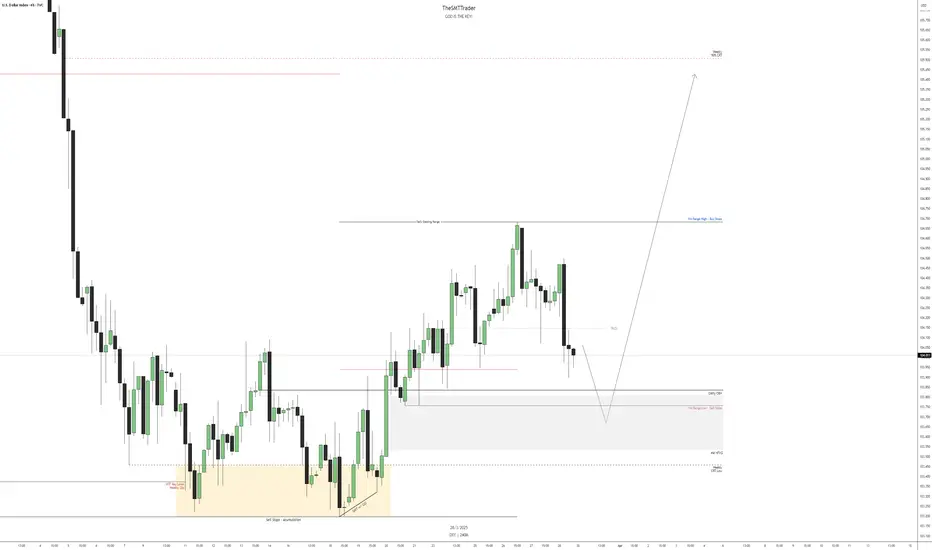
When analyzing the weekly DXY chart, we identify the presence of two CRTs: one bullish and one bearish. However, the bearish CRT has a low probability of success due to the candle formation and the fact that the price is still in a discounted region within the range.
Given this, our initial expectation is for the price to drop at the beginning of the week to seek liquidity in the equilibrium region of the daily range, which coincides with the 50% level of the bearish CRT. This movement may act as a correction within the predominant trend, pushing the price up toward the premium region of the weekly range. From that point, we will once again look for selling opportunities, as the market may resume its downward movement.
Based on this analysis, we initially seek selling opportunities down to the equilibrium region. Once this level is reached, we will wait for confirmation of a bullish reversal to look for buying opportunities up to the 50% mark of the bullish CRT.

면책사항
해당 정보와 게시물은 금융, 투자, 트레이딩 또는 기타 유형의 조언이나 권장 사항으로 간주되지 않으며, 트레이딩뷰에서 제공하거나 보증하는 것이 아닙니다. 자세한 내용은 이용 약관을 참조하세요.
면책사항
해당 정보와 게시물은 금융, 투자, 트레이딩 또는 기타 유형의 조언이나 권장 사항으로 간주되지 않으며, 트레이딩뷰에서 제공하거나 보증하는 것이 아닙니다. 자세한 내용은 이용 약관을 참조하세요.