
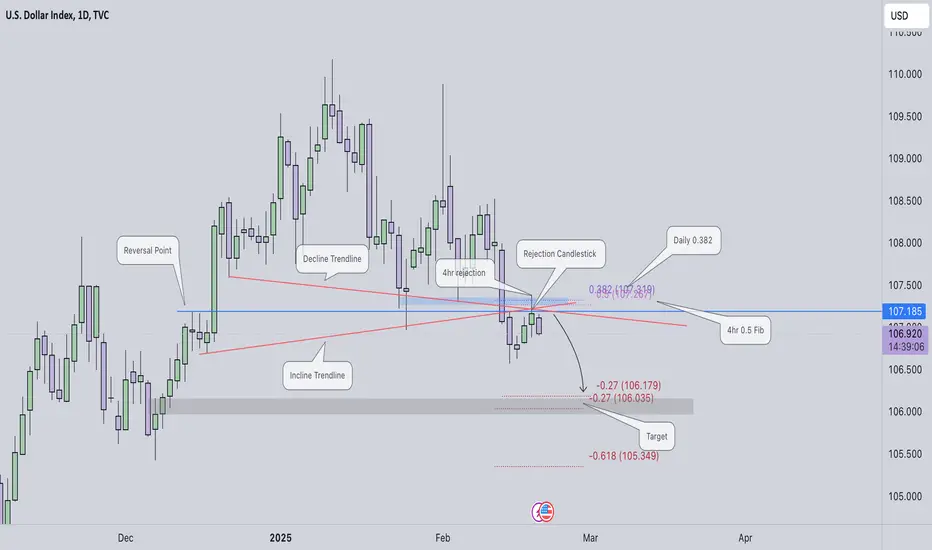
The US Dollar Index (DXY) is currently indicating the likely direction after closing below 106.965. I anticipate a move back to the 107.200-250 range before continuing its bearish swing. Several confluences support this, including the reversal point, an ascending trendline, a descending trendline, a rejection candlestick, the daily 0.382 Fibonacci level, the 4-hour 0.5 Fibonacci level, and a 4-hour order block. My target for the DXY is 106.083. As for gold, it has reached a new all-time high of 2954.944. I expect a pullback before it heads higher, potentially towards the 3000 level.
4hr DXY Chart

1hr DXY Chart

30m Gold Chart

4hr DXY Chart
1hr DXY Chart
30m Gold Chart

면책사항
해당 정보와 게시물은 금융, 투자, 트레이딩 또는 기타 유형의 조언이나 권장 사항으로 간주되지 않으며, 트레이딩뷰에서 제공하거나 보증하는 것이 아닙니다. 자세한 내용은 이용 약관을 참조하세요.
면책사항
해당 정보와 게시물은 금융, 투자, 트레이딩 또는 기타 유형의 조언이나 권장 사항으로 간주되지 않으며, 트레이딩뷰에서 제공하거나 보증하는 것이 아닙니다. 자세한 내용은 이용 약관을 참조하세요.