This is more of a thought, than a trading idea...
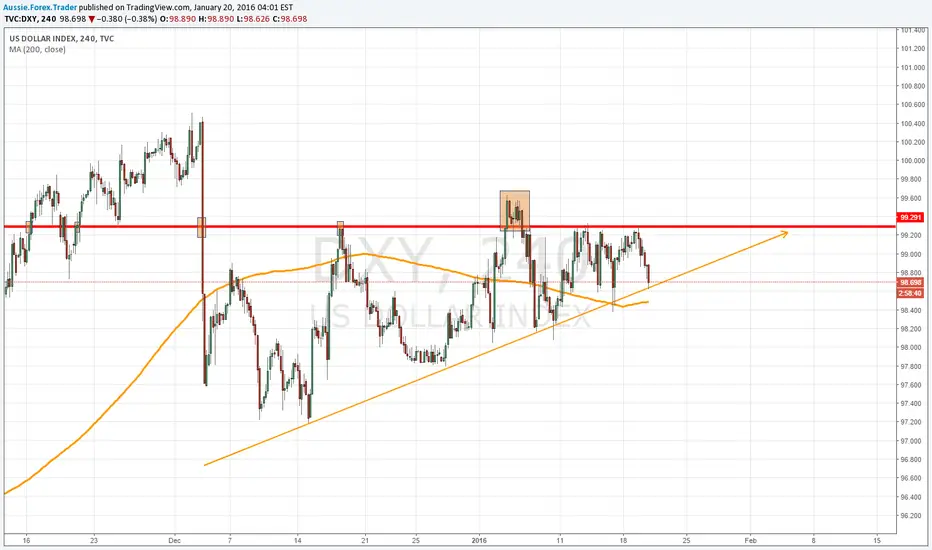
There is a rising wedge, of which is about to complete, on DXY.
DXY.
This is a bearish pattern, and if I'm correct, its full formation may coincide with the latest USD data that is due to be released on Thursday.
There is a rising wedge, of which is about to complete, on
DXY. This is a bearish pattern, and if I'm correct, its full formation may coincide with the latest USD data that is due to be released on Thursday.
노트
This wasn't the best example or a rising wedge, it's more like a rising triangle (yes, I see price on 05/01/16 broke 99.27). However, what this chart does tell us is that something huge is about to happen. USD will either smash its way up, or resume its downtrend.
면책사항
해당 정보와 게시물은 금융, 투자, 트레이딩 또는 기타 유형의 조언이나 권장 사항으로 간주되지 않으며, 트레이딩뷰에서 제공하거나 보증하는 것이 아닙니다. 자세한 내용은 이용 약관을 참조하세요.
면책사항
해당 정보와 게시물은 금융, 투자, 트레이딩 또는 기타 유형의 조언이나 권장 사항으로 간주되지 않으며, 트레이딩뷰에서 제공하거나 보증하는 것이 아닙니다. 자세한 내용은 이용 약관을 참조하세요.