
Hello,
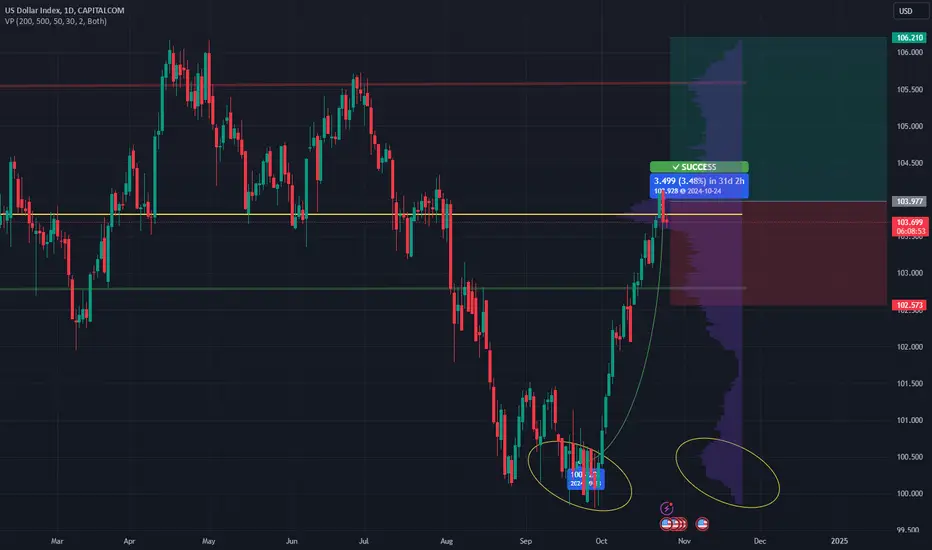
The unusually high market activity around the 100.5 level indicated strong bullish accumulation. The yellow ellipses highlight the volume and price levels. You can see that volume decreases both above and below this key level. This accumulation is evident because the price broke out of a bullish consolidation pattern, as shown in the left yellow circle, reaching a high of 103.9, indicated by the yellow line. This is the current level, where you may notice exceptionally high market activity. As the price remains above the green demand zone, the red supply zone may be tested, as suggested by the volume profile.
Regards,
Ely
The unusually high market activity around the 100.5 level indicated strong bullish accumulation. The yellow ellipses highlight the volume and price levels. You can see that volume decreases both above and below this key level. This accumulation is evident because the price broke out of a bullish consolidation pattern, as shown in the left yellow circle, reaching a high of 103.9, indicated by the yellow line. This is the current level, where you may notice exceptionally high market activity. As the price remains above the green demand zone, the red supply zone may be tested, as suggested by the volume profile.
Regards,
Ely
거래청산: 타겟 닿음
The analytics indicated the chart's potential return to the 105.6 level, which area is above the red line. The chart fulfilled the indication without falling under the 102.8 level marked by the green line at the bottom of the stop loss box. Considering these developments, the indication of realized profit can now be marked complete. 💸
면책사항
해당 정보와 게시물은 금융, 투자, 트레이딩 또는 기타 유형의 조언이나 권장 사항으로 간주되지 않으며, 트레이딩뷰에서 제공하거나 보증하는 것이 아닙니다. 자세한 내용은 이용 약관을 참조하세요.
면책사항
해당 정보와 게시물은 금융, 투자, 트레이딩 또는 기타 유형의 조언이나 권장 사항으로 간주되지 않으며, 트레이딩뷰에서 제공하거나 보증하는 것이 아닙니다. 자세한 내용은 이용 약관을 참조하세요.