
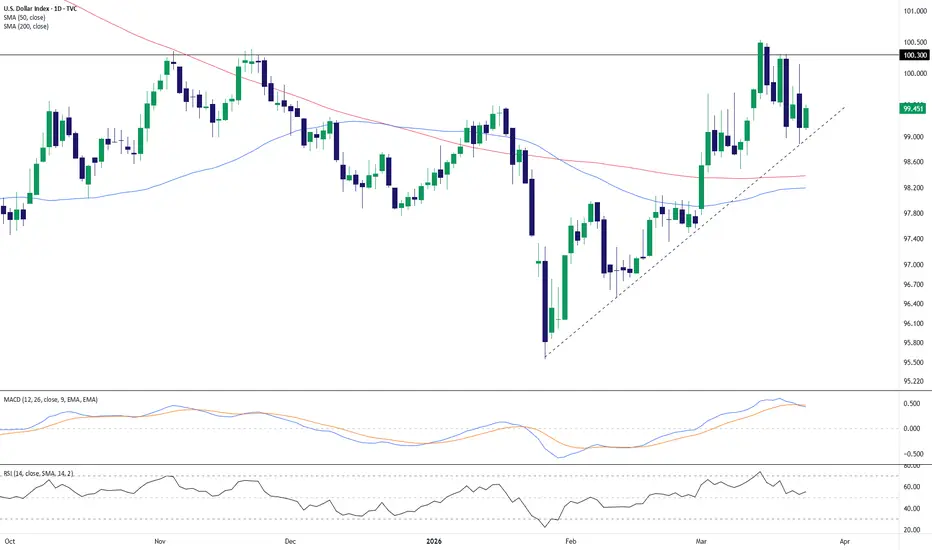
The U.S. Dollar Index is pressing into a well-defined resistance zone near 100.30 after a strong recovery from the late-January low. Price structure has improved notably, with the recent advance respecting a rising trendline and producing a sequence of higher lows into March. That said, the latest candles show hesitation just beneath resistance, suggesting the market is deciding whether this move has enough strength to continue.
From a moving average perspective, price is trading above both the 50-day SMA and the 200-day SMA, which keeps the broader tone constructive. The 50-day average has also crossed above the 200-day average, reinforcing the improvement in medium-term trend conditions. As long as price remains above that rising support structure, the bullish recovery remains technically intact.
Momentum indicators are a bit more mixed in the near term. MACD remains above the zero line, which supports the idea that upside momentum has improved versus earlier in the quarter, but the MACD line appears to be flattening and slightly rolling over against the signal line. RSI is holding around the mid-50s, showing positive but not overextended momentum. In other words, the chart still leans firm overall, though momentum is no longer accelerating as strongly as it was during the initial breakout phase.
The key technical focus here is the interaction between ascending trendline support and horizontal resistance around 100.30. A sustained push through that ceiling would strengthen the current recovery structure, while another rejection could keep DXY rotating sideways as momentum resets.
-MW
From a moving average perspective, price is trading above both the 50-day SMA and the 200-day SMA, which keeps the broader tone constructive. The 50-day average has also crossed above the 200-day average, reinforcing the improvement in medium-term trend conditions. As long as price remains above that rising support structure, the bullish recovery remains technically intact.
Momentum indicators are a bit more mixed in the near term. MACD remains above the zero line, which supports the idea that upside momentum has improved versus earlier in the quarter, but the MACD line appears to be flattening and slightly rolling over against the signal line. RSI is holding around the mid-50s, showing positive but not overextended momentum. In other words, the chart still leans firm overall, though momentum is no longer accelerating as strongly as it was during the initial breakout phase.
The key technical focus here is the interaction between ascending trendline support and horizontal resistance around 100.30. A sustained push through that ceiling would strengthen the current recovery structure, while another rejection could keep DXY rotating sideways as momentum resets.
-MW

면책사항
해당 정보와 게시물은 금융, 투자, 트레이딩 또는 기타 유형의 조언이나 권장 사항으로 간주되지 않으며, 트레이딩뷰에서 제공하거나 보증하는 것이 아닙니다. 자세한 내용은 이용 약관을 참조하세요.
면책사항
해당 정보와 게시물은 금융, 투자, 트레이딩 또는 기타 유형의 조언이나 권장 사항으로 간주되지 않으며, 트레이딩뷰에서 제공하거나 보증하는 것이 아닙니다. 자세한 내용은 이용 약관을 참조하세요.