
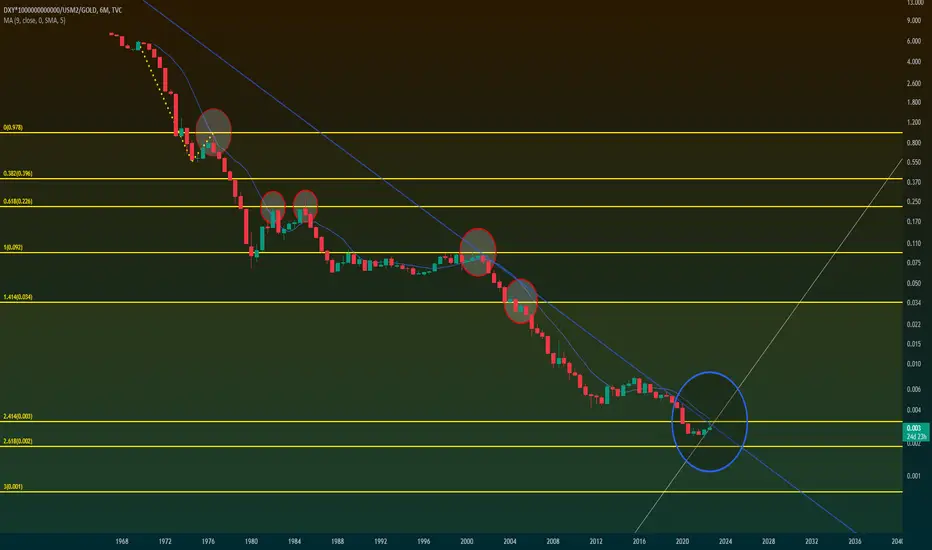
The Graph presents DXY/GOLD = Inverse price of gold. Given Fibonacci levels have acted as great resistance/support lines, therefore might predict the next bull-run for gold. DXY/Gold is retesting its 2.414 Fibonacci resistance to break down; which is a bullish signal for gold.
Fundamentally (refer to main graph)
- Gold is a great inflation hedge
- Currently massively undervalued
- Falling returns or/and outlook on substitute investmentment instruments
Technically (these 2 graphs)
- Previous retests from Fib levels have shown a 100% accuracy on the 6M timeframe
(breakouts represented by red circules and current by the blue circule)
- The diagonal blue resistance line (which rejected 100% breakouts) has been reached with a significant rebound below the fib level.
- The MA is extremely close to both the FIB and blue line resistance levels.
Fun fact: These fib levels have been determined through price history between the years 1969-1976.
1M timeframe:

1W timeframe:

Thanks for your time!
Fundamentally (refer to main graph)
- Gold is a great inflation hedge
- Currently massively undervalued
- Falling returns or/and outlook on substitute investmentment instruments
Technically (these 2 graphs)
- Previous retests from Fib levels have shown a 100% accuracy on the 6M timeframe
(breakouts represented by red circules and current by the blue circule)
- The diagonal blue resistance line (which rejected 100% breakouts) has been reached with a significant rebound below the fib level.
- The MA is extremely close to both the FIB and blue line resistance levels.
Fun fact: These fib levels have been determined through price history between the years 1969-1976.
1M timeframe:
1W timeframe:
Thanks for your time!

관련 발행물
면책사항
해당 정보와 게시물은 금융, 투자, 트레이딩 또는 기타 유형의 조언이나 권장 사항으로 간주되지 않으며, 트레이딩뷰에서 제공하거나 보증하는 것이 아닙니다. 자세한 내용은 이용 약관을 참조하세요.
면책사항
해당 정보와 게시물은 금융, 투자, 트레이딩 또는 기타 유형의 조언이나 권장 사항으로 간주되지 않으며, 트레이딩뷰에서 제공하거나 보증하는 것이 아닙니다. 자세한 내용은 이용 약관을 참조하세요.