
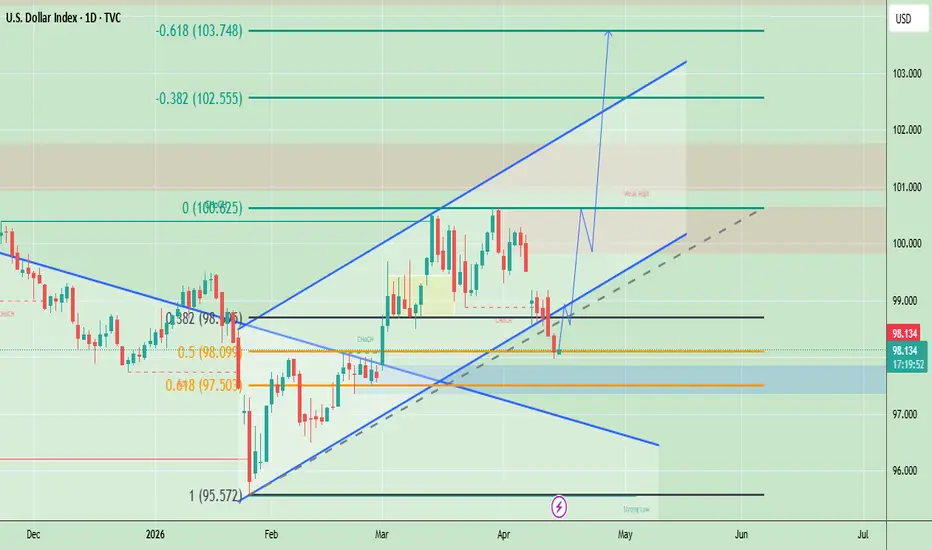
The US Dollar Index (DXY) is currently moving around the 98.10 support zone after a corrective pullback and technically its reacting near a strong confluence area 98.00-97.50 previous structure and an ascending trendline. Price has already shown a rejection wick from this zone suggesting buyers are stepping in.
The overall structure still remains bullish as long as the trendline and 97.50 low hold with the next upside targets aligning toward 100.50 (range resistance) followed by 102.50 and potentially 103.70.
From a fundamentals perspective the dollar is being supported by relatively stable US economic data sticky inflation expectations and cautious Federal Reserve outlook but upside momentum is slightly slow due to mixed signals on rate cuts and global risk sentiment.
Trade Plan – Buy Setup
Buy Zone: 97.50-8.10
Trigger: H1 bullish rejection (long wick) or strong bullish engulfing from support + trendline hold
Targets: 99.20 (gap fill), 100.50, 102.50
Invalidation: H1 close below 97.20
Note
Please risk management in trading is a Key so use your money accordingly. If you like the idea then please like and boost. Thank you and Good Luck!
The overall structure still remains bullish as long as the trendline and 97.50 low hold with the next upside targets aligning toward 100.50 (range resistance) followed by 102.50 and potentially 103.70.
From a fundamentals perspective the dollar is being supported by relatively stable US economic data sticky inflation expectations and cautious Federal Reserve outlook but upside momentum is slightly slow due to mixed signals on rate cuts and global risk sentiment.
Trade Plan – Buy Setup
Buy Zone: 97.50-8.10
Trigger: H1 bullish rejection (long wick) or strong bullish engulfing from support + trendline hold
Targets: 99.20 (gap fill), 100.50, 102.50
Invalidation: H1 close below 97.20
Note
Please risk management in trading is a Key so use your money accordingly. If you like the idea then please like and boost. Thank you and Good Luck!

면책사항
해당 정보와 게시물은 금융, 투자, 트레이딩 또는 기타 유형의 조언이나 권장 사항으로 간주되지 않으며, 트레이딩뷰에서 제공하거나 보증하는 것이 아닙니다. 자세한 내용은 이용 약관을 참조하세요.
면책사항
해당 정보와 게시물은 금융, 투자, 트레이딩 또는 기타 유형의 조언이나 권장 사항으로 간주되지 않으며, 트레이딩뷰에서 제공하거나 보증하는 것이 아닙니다. 자세한 내용은 이용 약관을 참조하세요.