
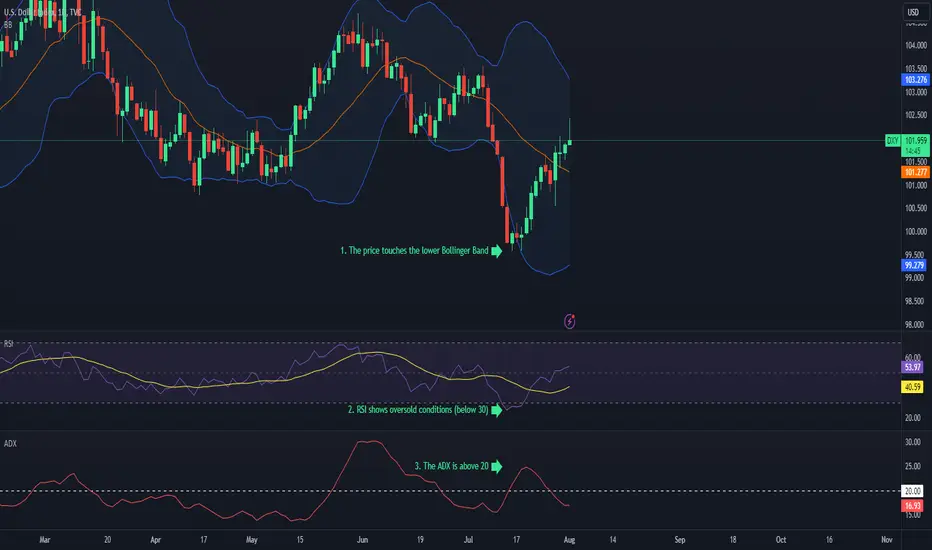
"Super Swing Strategy" - Bollinger Bands, RSI, and ADX Strategy
Indicators Used:
- Bollinger Bands
- Relative Strength Index (RSI)
- Average Directional Index (ADX)
Bollinger Bands for volatility, RSI for overbought and oversold conditions, and ADX for strength of the trend.
How it Works:
Add Bollinger Bands, a 14-period RSI, and a 14-period ADX to your chart.
When the price touches the upper Bollinger Band, the RSI shows overbought conditions (above 70), and the ADX is above 20, it's a potential bearish signal.
A bullish signal occurs when the price touches the lower Bollinger Band, the RSI shows oversold conditions (below 30), and the ADX is above 20.
You can use additional indicators or price action analysis to confirm signals.
Indicators Used:
- Bollinger Bands
- Relative Strength Index (RSI)
- Average Directional Index (ADX)
Bollinger Bands for volatility, RSI for overbought and oversold conditions, and ADX for strength of the trend.
How it Works:
Add Bollinger Bands, a 14-period RSI, and a 14-period ADX to your chart.
When the price touches the upper Bollinger Band, the RSI shows overbought conditions (above 70), and the ADX is above 20, it's a potential bearish signal.
A bullish signal occurs when the price touches the lower Bollinger Band, the RSI shows oversold conditions (below 30), and the ADX is above 20.
You can use additional indicators or price action analysis to confirm signals.

면책사항
해당 정보와 게시물은 금융, 투자, 트레이딩 또는 기타 유형의 조언이나 권장 사항으로 간주되지 않으며, 트레이딩뷰에서 제공하거나 보증하는 것이 아닙니다. 자세한 내용은 이용 약관을 참조하세요.
면책사항
해당 정보와 게시물은 금융, 투자, 트레이딩 또는 기타 유형의 조언이나 권장 사항으로 간주되지 않으며, 트레이딩뷰에서 제공하거나 보증하는 것이 아닙니다. 자세한 내용은 이용 약관을 참조하세요.