
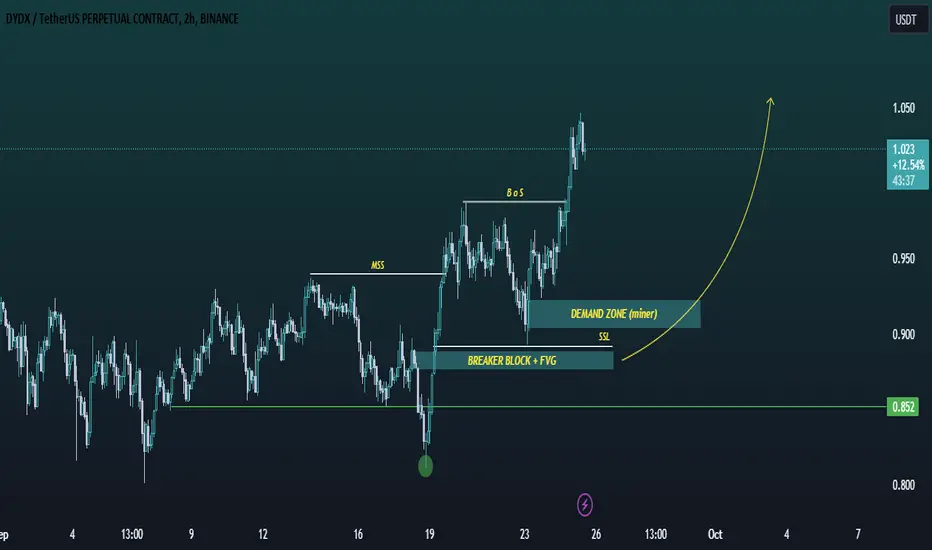
DYDX/USDT shifted its structure into bullish after MSS (marked on the chart). It continued its bullish move and did BOS (also marked on the chart). Price can not go straight up. As we are in bullish trend so we have to look for long oppertunities. By the way I have marked two long areas on the chart. First one is miner demand zone and second is a good swing long oppertunity with DCA of green horizental line.

면책사항
해당 정보와 게시물은 금융, 투자, 트레이딩 또는 기타 유형의 조언이나 권장 사항으로 간주되지 않으며, 트레이딩뷰에서 제공하거나 보증하는 것이 아닙니다. 자세한 내용은 이용 약관을 참조하세요.
면책사항
해당 정보와 게시물은 금융, 투자, 트레이딩 또는 기타 유형의 조언이나 권장 사항으로 간주되지 않으며, 트레이딩뷰에서 제공하거나 보증하는 것이 아닙니다. 자세한 내용은 이용 약관을 참조하세요.