Long
EB - texbook chart
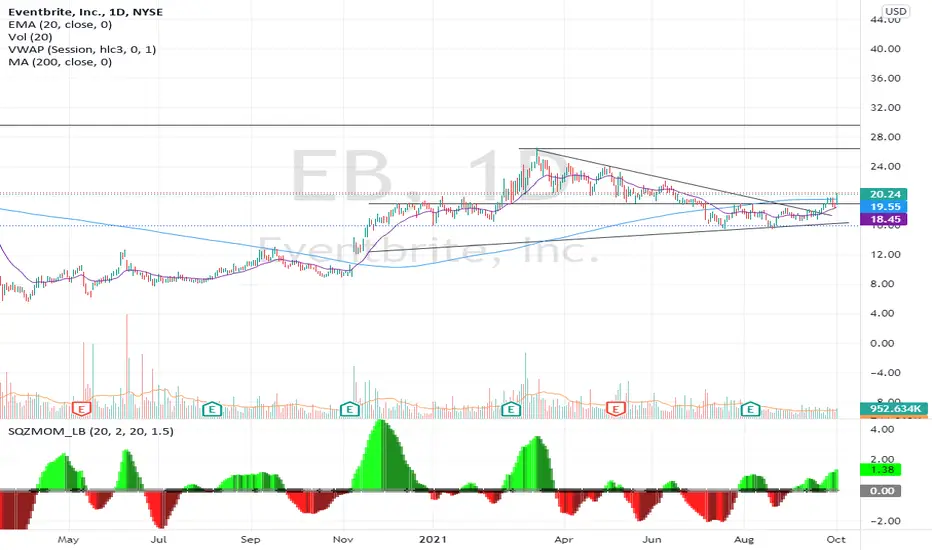
I went through a lot of charts this weekend. Most of them look choppy and ugly which is not surprising with this choppy market.
Picked this one which looks really healthy.
Just left the March-to-September downtrend, went above the strong level at 19.
Then made a healthy pull back, still hold arond the level. Yesterday - nice breakout.
MACD. RSI - positive
Weekly chart: breaking out from a wedge
Stop loss 18.40
Target 25
Picked this one which looks really healthy.
Just left the March-to-September downtrend, went above the strong level at 19.
Then made a healthy pull back, still hold arond the level. Yesterday - nice breakout.
MACD. RSI - positive
Weekly chart: breaking out from a wedge
Stop loss 18.40
Target 25

면책사항
해당 정보와 게시물은 금융, 투자, 트레이딩 또는 기타 유형의 조언이나 권장 사항으로 간주되지 않으며, 트레이딩뷰에서 제공하거나 보증하는 것이 아닙니다. 자세한 내용은 이용 약관을 참조하세요.
면책사항
해당 정보와 게시물은 금융, 투자, 트레이딩 또는 기타 유형의 조언이나 권장 사항으로 간주되지 않으며, 트레이딩뷰에서 제공하거나 보증하는 것이 아닙니다. 자세한 내용은 이용 약관을 참조하세요.