
 EDENUSDT
 ### 🔍 **Chart Overview**
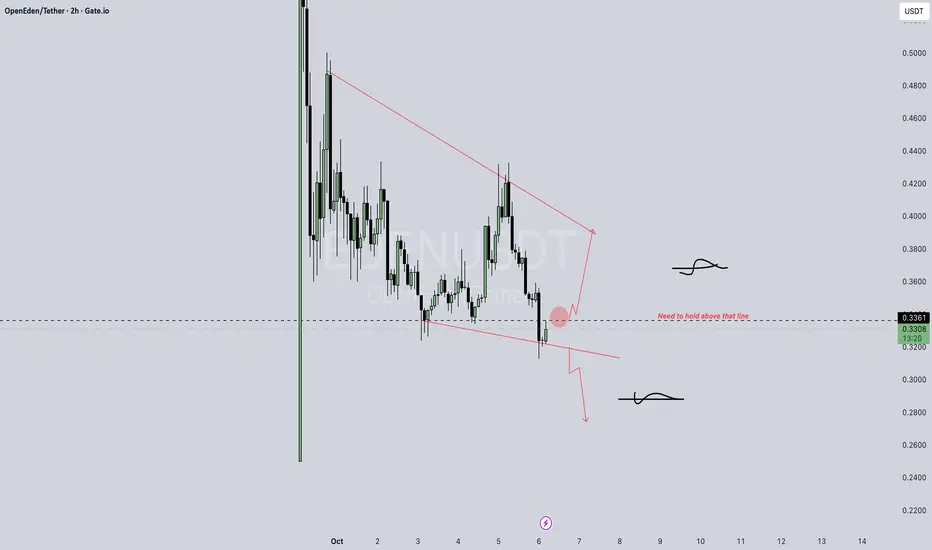
* **Pattern:** Falling wedge / descending channel — typically a *potential reversal pattern*.
* **Key Level:** Around **0.336** (marked “Need to hold above that line”).
* **Current Price:** ~0.33 USDT.
---
### 📈 **Bullish Scenario**
* If price **holds above 0.336** and confirms support, it could **break the wedge** upward.
* Possible targets:
* **First:** 0.38
* **Next:** 0.42–0.46
* Volume confirmation is important — breakout with low volume may be fake.
---
### 📉 **Bearish Scenario**
* If it **fails to hold 0.336** and drops below the lower red line →
* Next downside zones: **0.30 → 0.27**
* Could continue drifting until new support forms.
---
✅ **In short (not financial advice):**
> OpenEden is sitting at a key support. Holding above **0.336** = bullish bounce likely. Losing it = short-term bearish continuation.

면책사항
해당 정보와 게시물은 금융, 투자, 트레이딩 또는 기타 유형의 조언이나 권장 사항으로 간주되지 않으며, 트레이딩뷰에서 제공하거나 보증하는 것이 아닙니다. 자세한 내용은 이용 약관을 참조하세요.
면책사항
해당 정보와 게시물은 금융, 투자, 트레이딩 또는 기타 유형의 조언이나 권장 사항으로 간주되지 않으며, 트레이딩뷰에서 제공하거나 보증하는 것이 아닙니다. 자세한 내용은 이용 약관을 참조하세요.