
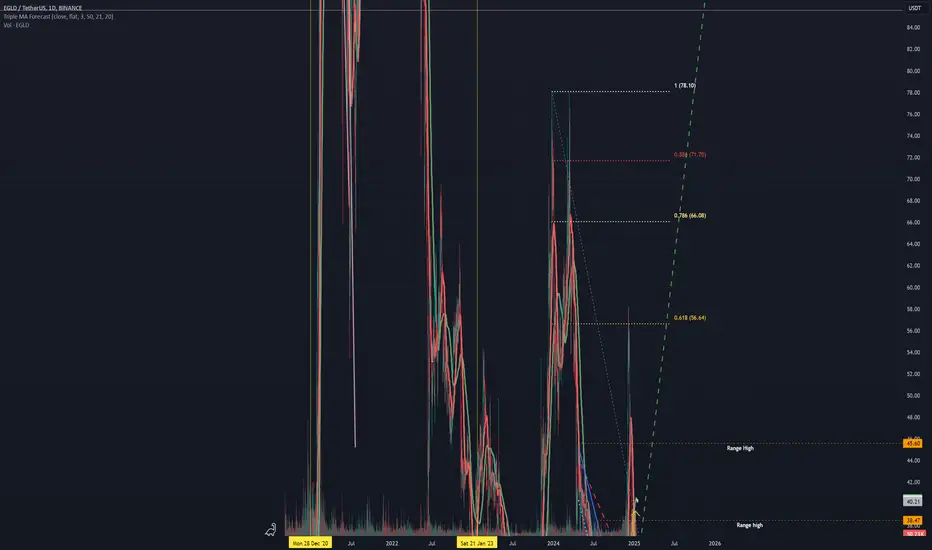
The price of EGLD has successfully broken out of its downward parallel channel, which lasted from April to November 2024. After reaching a high of around $55, the price retraced, giving back some of its earlier gains, but is now holding above the $30 support level.

Although the price faced significant selling pressure, it has remained above the previous range and the downward trendline (now acting as support).
From January 3 to January 6, the price attempted to break above the range but fell back to the lows of the range. Since then, a diamond pattern has emerged on the 1H and 4H timeframes, signaling a potential bullish reversal. If the price holds above $32, the diamond pattern remains valid, and a move to the upside is anticipated. This could lead to a retest of the range’s upper range around $40. A successful breakout may push the price towards higher resistance levels at $45–$55 and $75–$78.

Although the price faced significant selling pressure, it has remained above the previous range and the downward trendline (now acting as support).
From January 3 to January 6, the price attempted to break above the range but fell back to the lows of the range. Since then, a diamond pattern has emerged on the 1H and 4H timeframes, signaling a potential bullish reversal. If the price holds above $32, the diamond pattern remains valid, and a move to the upside is anticipated. This could lead to a retest of the range’s upper range around $40. A successful breakout may push the price towards higher resistance levels at $45–$55 and $75–$78.

관련 발행물
면책사항
해당 정보와 게시물은 금융, 투자, 트레이딩 또는 기타 유형의 조언이나 권장 사항으로 간주되지 않으며, 트레이딩뷰에서 제공하거나 보증하는 것이 아닙니다. 자세한 내용은 이용 약관을 참조하세요.
면책사항
해당 정보와 게시물은 금융, 투자, 트레이딩 또는 기타 유형의 조언이나 권장 사항으로 간주되지 않으며, 트레이딩뷰에서 제공하거나 보증하는 것이 아닙니다. 자세한 내용은 이용 약관을 참조하세요.