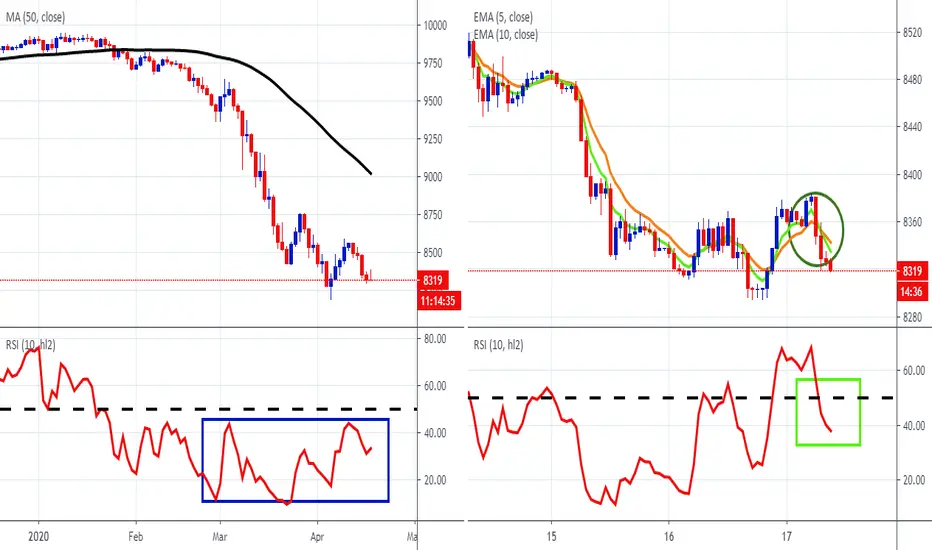
The left chart show's FXCM's emerging markets currency index, EMBASKET is black below its 50-day SMA. Moreover the SMA is pointing down with the RSI on the bearish side of 50 (blue rectangle). The right chart shows the hourly time frame. Here the green 5-hour EMA has crossed below the orange 10-hour EMA (green ellipse) and the RSI has moved below 50 (bright green rectangle). These are bearish developments and if the EMAs develop further angle and separation, the index will be showing further weak

Follow and Trade this analysis from your Charts. FXCM now Integrated with TradingView. Contact FXCM for more information.
면책사항
해당 정보와 게시물은 금융, 투자, 트레이딩 또는 기타 유형의 조언이나 권장 사항으로 간주되지 않으며, 트레이딩뷰에서 제공하거나 보증하는 것이 아닙니다. 자세한 내용은 이용 약관을 참조하세요.
면책사항
해당 정보와 게시물은 금융, 투자, 트레이딩 또는 기타 유형의 조언이나 권장 사항으로 간주되지 않으며, 트레이딩뷰에서 제공하거나 보증하는 것이 아닙니다. 자세한 내용은 이용 약관을 참조하세요.