롱
EMC2 Post pump, possible continuation.
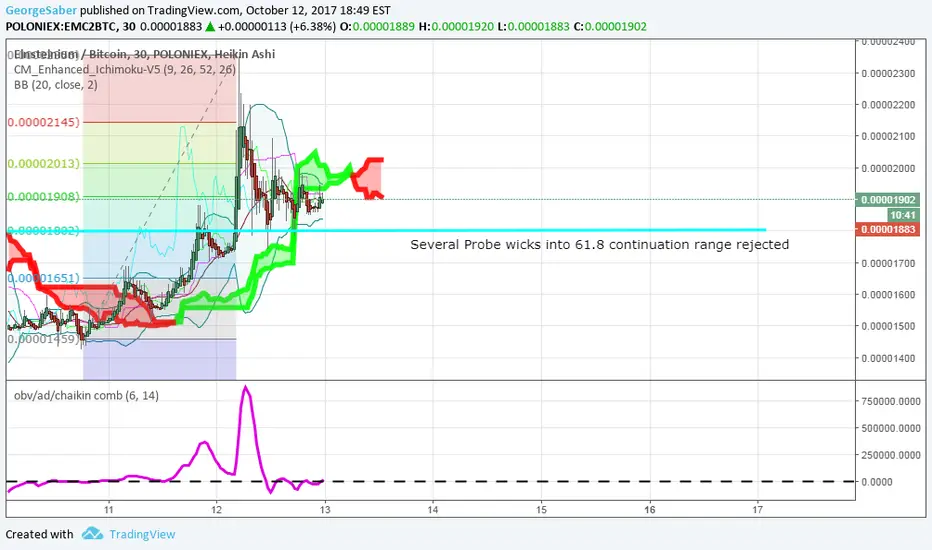
Last night's unexpected pump left EMC2 trading above 61.8 fib, continuation level;
Several probe wicks into 61.8 where rejected and eaten up.
I entered this trade just now, hoping for a continuation.
Chart appears to be at a volatile level, with Bollinger Bands tightening on the 30min time frame.
2hour chart shows all candles closing above red OBV chart; hence Bullish.
Yesterday's pump showed massive bullish wicks, and volume on bittrex is at 1700
OBV showing reduced selling/distribution.
I'm in and long; tell me if I'm wrong.

면책사항
해당 정보와 게시물은 금융, 투자, 트레이딩 또는 기타 유형의 조언이나 권장 사항으로 간주되지 않으며, 트레이딩뷰에서 제공하거나 보증하는 것이 아닙니다. 자세한 내용은 이용 약관을 참조하세요.
면책사항
해당 정보와 게시물은 금융, 투자, 트레이딩 또는 기타 유형의 조언이나 권장 사항으로 간주되지 않으며, 트레이딩뷰에서 제공하거나 보증하는 것이 아닙니다. 자세한 내용은 이용 약관을 참조하세요.