업데이트됨
EOS/BTC Update
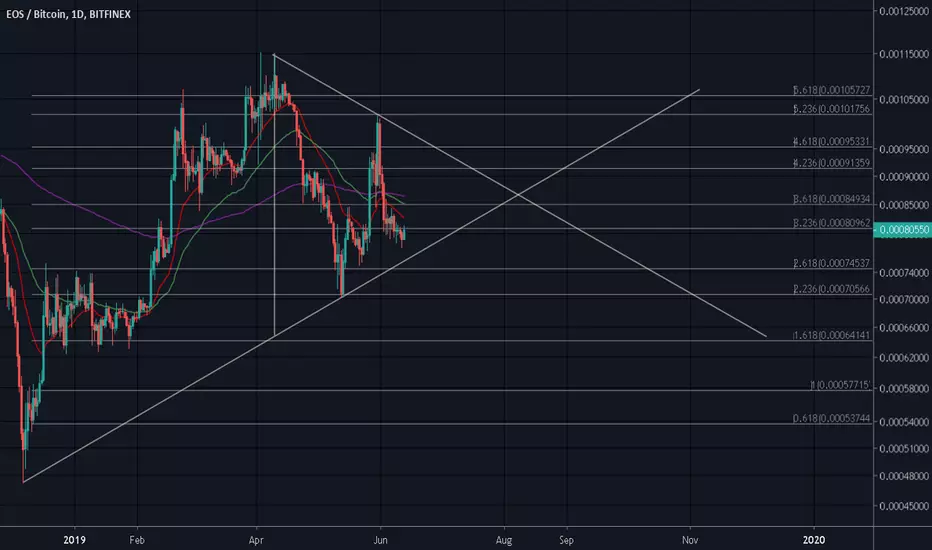
On 1 Day timeframe

DMI , DMX(strenght momentum) is fallen sharply while dmi+(green line/bullish trend) below dmi- (red line/bearish trend) and still closing with each other indicate a bearish momentum is slight dominate over bullish trend with low strenght currently.
MACD, macd line and signal line is get rejected back to bearish area although the seller histogram is decreasing it's strength and ready to switch into buyer histogram near future.
This 'potential' symmetrical triangle will be invalidated once the price action by prolonged side ways movement.
Peace
DMI , DMX(strenght momentum) is fallen sharply while dmi+(green line/bullish trend) below dmi- (red line/bearish trend) and still closing with each other indicate a bearish momentum is slight dominate over bullish trend with low strenght currently.
MACD, macd line and signal line is get rejected back to bearish area although the seller histogram is decreasing it's strength and ready to switch into buyer histogram near future.
This 'potential' symmetrical triangle will be invalidated once the price action by prolonged side ways movement.
Peace
노트
- Short term bounce is expected from the way of indicators look. stochastic is bottom out. Slight bullish divergence between histogram seller and price action as it's made a lower low but a higher low in buyer histogram MACD.
while overall trend is still bearish from DMI indicator

면책사항
해당 정보와 게시물은 금융, 투자, 트레이딩 또는 기타 유형의 조언이나 권장 사항으로 간주되지 않으며, 트레이딩뷰에서 제공하거나 보증하는 것이 아닙니다. 자세한 내용은 이용 약관을 참조하세요.
면책사항
해당 정보와 게시물은 금융, 투자, 트레이딩 또는 기타 유형의 조언이나 권장 사항으로 간주되지 않으며, 트레이딩뷰에서 제공하거나 보증하는 것이 아닙니다. 자세한 내용은 이용 약관을 참조하세요.