EOS Technical Analysis: Bulls Forge ahead
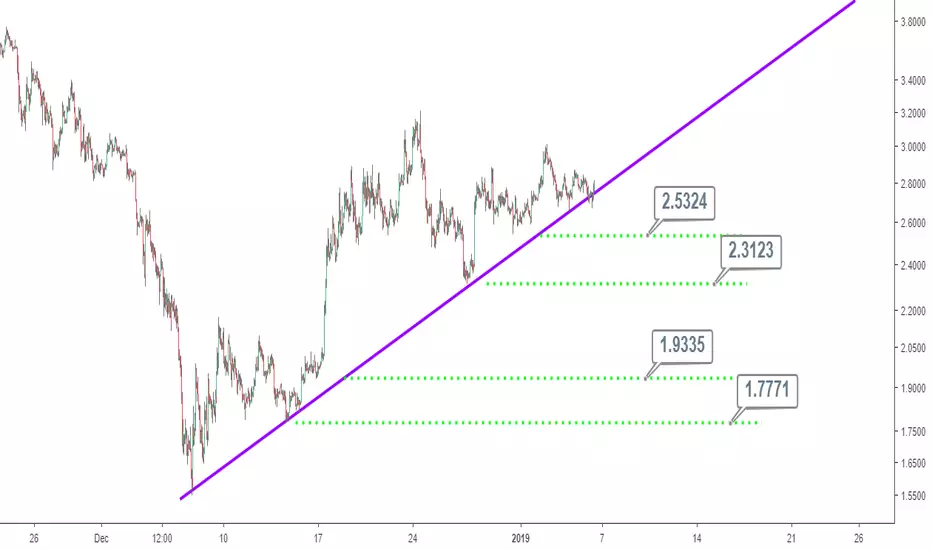
EOS price analysis for today is presented on the 1 hour timeframe. The week of April 30, 2018 saw price establish a bearish trend that possibly has terminated at 1.5500.
This is due to the onset of bullish momentum from the above mentioned price level to a price high of 3.2081 on December 24, 2018. Price closing below 1.5500 implies resumption of bearish trend, while a bullish trendline used to highlight the current trend in EOS.
Support is anticipated at the trendline, while lower regions of support on the chart are between 2.5324 and 2.3123, as well as 1.9335 and 1.7771.
Price closing above 3.2081 is the most conservative way to establish long (buy) positions.

관련 발행물
면책사항
해당 정보와 게시물은 금융, 투자, 트레이딩 또는 기타 유형의 조언이나 권장 사항으로 간주되지 않으며, 트레이딩뷰에서 제공하거나 보증하는 것이 아닙니다. 자세한 내용은 이용 약관을 참조하세요.
관련 발행물
면책사항
해당 정보와 게시물은 금융, 투자, 트레이딩 또는 기타 유형의 조언이나 권장 사항으로 간주되지 않으며, 트레이딩뷰에서 제공하거나 보증하는 것이 아닙니다. 자세한 내용은 이용 약관을 참조하세요.