롱
EOSUSDT
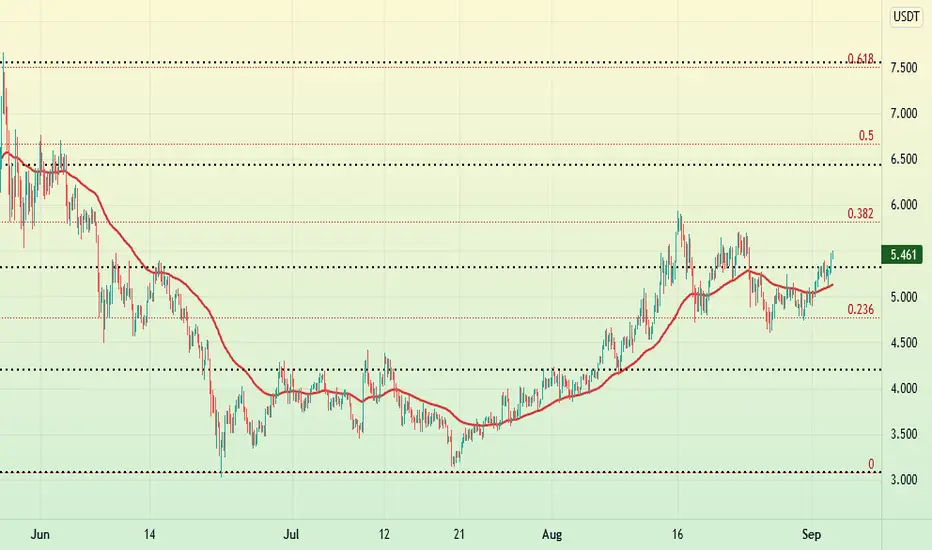
Look at black dotted lines on my chart...
They are support & resistance for moving average thats mean when MA cross above or below this lines,Price starting to Reaction
For example On EOS 4H chart when MA cross above 5.31 line, price will go to the next resistance on 6.4 & 7.5
Crossing MA on upper time frame like Daily, Weekly , ... will be bigger but i prefer to work on 4H time frame

면책사항
해당 정보와 게시물은 금융, 투자, 트레이딩 또는 기타 유형의 조언이나 권장 사항으로 간주되지 않으며, 트레이딩뷰에서 제공하거나 보증하는 것이 아닙니다. 자세한 내용은 이용 약관을 참조하세요.
면책사항
해당 정보와 게시물은 금융, 투자, 트레이딩 또는 기타 유형의 조언이나 권장 사항으로 간주되지 않으며, 트레이딩뷰에서 제공하거나 보증하는 것이 아닙니다. 자세한 내용은 이용 약관을 참조하세요.