
A while ago, the thesis on EPIC was simple:
"If it gets attention, it can move hard."
The approach was never to go all-in. The idea was to accumulate during weakness, take profits into strength, and treat EPIC as a high-risk speculative position rather than a core holding.
The market rewarded that approach.
• Accumulation opportunities appeared around $0.20-$0.30
• The inverse Head & Shoulders structure developed successfully
• The neckline breakout triggered
• Price surged above $1.00
• The first major target zone was reached
• Heavy distribution followed immediately afterward
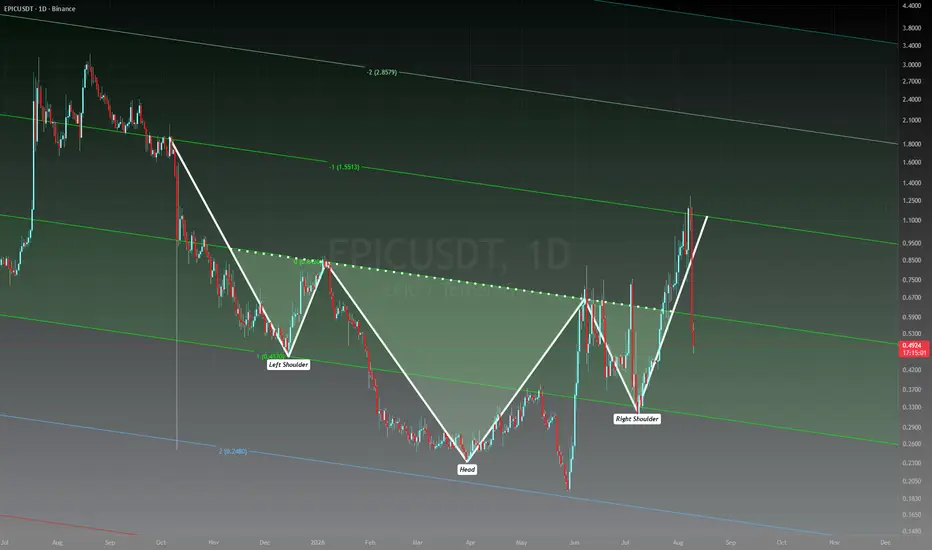
Today, EPIC sits more than 60% below the local high, and the chart is entering an important decision zone.
What Happened?
The daily chart formed a large inverse Head & Shoulders reversal pattern over several months.
• Left Shoulder near $0.45
• Head near $0.24
• Right Shoulder near $0.30
• Neckline around $0.65-$0.70
Once the neckline was broken, buyers stepped in aggressively and pushed price toward the first projected objective around the $1.10-$1.20 region.
That target zone was ultimately achieved.
From a technical standpoint, this is where many successful trades naturally come to an end. A pattern reaches its objective, early investors lock in gains, momentum traders begin taking profits, and fresh demand struggles to absorb supply.
That appears to be exactly what happened here.
The Market Delivered the Reward... Then Took Back the Euphoria
After reaching the target zone above $1.00, EPIC experienced an aggressive selloff.
In just a short period, more than 60% of the advance was erased.
While painful for late buyers, this behavior is not uncommon after explosive rallies.
Markets often reward patience during accumulation phases and punish emotional buying after a move becomes obvious.
Those who followed risk management plans had opportunities to realize substantial gains near target levels.
Those who entered after the breakout excitement are now facing the other side of volatility.
Current Technical Picture
Support Zone: $0.45-$0.50
This is currently the most important area on the chart.
There are several reasons why this region matters:
• Previous Left Shoulder formed here
• Historical buying activity is concentrated here
• Current market price is testing this area after the correction
As long as this zone remains intact, the larger bullish structure remains technically alive.
Secondary Support: $0.30-$0.35
If sellers break the current support area decisively, attention may shift toward the former Right Shoulder region.
This area would likely become the next major demand zone where buyers attempt to defend the broader recovery trend.
Resistance Zone: $0.75-$0.80
Any bounce from current levels will likely face resistance here.
This area previously acted as a breakout region and may now serve as the first significant obstacle for recovering bulls.
Major Resistance: $1.00-$1.20
The market has already identified this zone as a major supply area.
A future break above this region would signal that buyers have regained control and that the current correction may have merely been a pause within a larger trend.
Bullish Scenario
• Support around $0.45-$0.50 holds
• Selling pressure gradually weakens
• A higher low develops
• Buyers build a new accumulation range
• Price attempts a recovery toward $0.80 and eventually $1.00+
Bearish Scenario
• Current support fails
• Price loses the former Left Shoulder area
• Momentum shifts back to sellers
• EPIC revisits the $0.30-$0.35 region
• Extended consolidation becomes necessary before another meaningful advance
Final Thoughts
The original idea achieved its objective.
Accumulating during weakness and reducing exposure into strength proved far more effective than chasing momentum after the breakout.
The first chapter of this reversal story is now complete.
The target was reached.
The market celebrated.
Then the market corrected.
Now all eyes are on the $0.45-$0.50 region.
If bulls successfully defend this battlefield, EPIC may begin building the foundation for a second leg higher.
If not, a deeper reset may be required before the next major opportunity emerges.
As always, manage risk accordingly. Volatility works both ways.
"If it gets attention, it can move hard."
The approach was never to go all-in. The idea was to accumulate during weakness, take profits into strength, and treat EPIC as a high-risk speculative position rather than a core holding.
The market rewarded that approach.
• Accumulation opportunities appeared around $0.20-$0.30
• The inverse Head & Shoulders structure developed successfully
• The neckline breakout triggered
• Price surged above $1.00
• The first major target zone was reached
• Heavy distribution followed immediately afterward
Today, EPIC sits more than 60% below the local high, and the chart is entering an important decision zone.
What Happened?
The daily chart formed a large inverse Head & Shoulders reversal pattern over several months.
• Left Shoulder near $0.45
• Head near $0.24
• Right Shoulder near $0.30
• Neckline around $0.65-$0.70
Once the neckline was broken, buyers stepped in aggressively and pushed price toward the first projected objective around the $1.10-$1.20 region.
That target zone was ultimately achieved.
From a technical standpoint, this is where many successful trades naturally come to an end. A pattern reaches its objective, early investors lock in gains, momentum traders begin taking profits, and fresh demand struggles to absorb supply.
That appears to be exactly what happened here.
The Market Delivered the Reward... Then Took Back the Euphoria
After reaching the target zone above $1.00, EPIC experienced an aggressive selloff.
In just a short period, more than 60% of the advance was erased.
While painful for late buyers, this behavior is not uncommon after explosive rallies.
Markets often reward patience during accumulation phases and punish emotional buying after a move becomes obvious.
Those who followed risk management plans had opportunities to realize substantial gains near target levels.
Those who entered after the breakout excitement are now facing the other side of volatility.
Current Technical Picture
Support Zone: $0.45-$0.50
This is currently the most important area on the chart.
There are several reasons why this region matters:
• Previous Left Shoulder formed here
• Historical buying activity is concentrated here
• Current market price is testing this area after the correction
As long as this zone remains intact, the larger bullish structure remains technically alive.
Secondary Support: $0.30-$0.35
If sellers break the current support area decisively, attention may shift toward the former Right Shoulder region.
This area would likely become the next major demand zone where buyers attempt to defend the broader recovery trend.
Resistance Zone: $0.75-$0.80
Any bounce from current levels will likely face resistance here.
This area previously acted as a breakout region and may now serve as the first significant obstacle for recovering bulls.
Major Resistance: $1.00-$1.20
The market has already identified this zone as a major supply area.
A future break above this region would signal that buyers have regained control and that the current correction may have merely been a pause within a larger trend.
Bullish Scenario
• Support around $0.45-$0.50 holds
• Selling pressure gradually weakens
• A higher low develops
• Buyers build a new accumulation range
• Price attempts a recovery toward $0.80 and eventually $1.00+
Bearish Scenario
• Current support fails
• Price loses the former Left Shoulder area
• Momentum shifts back to sellers
• EPIC revisits the $0.30-$0.35 region
• Extended consolidation becomes necessary before another meaningful advance
Final Thoughts
The original idea achieved its objective.
Accumulating during weakness and reducing exposure into strength proved far more effective than chasing momentum after the breakout.
The first chapter of this reversal story is now complete.
The target was reached.
The market celebrated.
Then the market corrected.
Now all eyes are on the $0.45-$0.50 region.
If bulls successfully defend this battlefield, EPIC may begin building the foundation for a second leg higher.
If not, a deeper reset may be required before the next major opportunity emerges.
As always, manage risk accordingly. Volatility works both ways.

Show your piety to your god. World needs your humanity.
관련 발행물
면책사항
해당 정보와 게시물은 금융, 투자, 트레이딩 또는 기타 유형의 조언이나 권장 사항으로 간주되지 않으며, 트레이딩뷰에서 제공하거나 보증하는 것이 아닙니다. 자세한 내용은 이용 약관을 참조하세요.
Show your piety to your god. World needs your humanity.
관련 발행물
면책사항
해당 정보와 게시물은 금융, 투자, 트레이딩 또는 기타 유형의 조언이나 권장 사항으로 간주되지 않으며, 트레이딩뷰에서 제공하거나 보증하는 것이 아닙니다. 자세한 내용은 이용 약관을 참조하세요.