
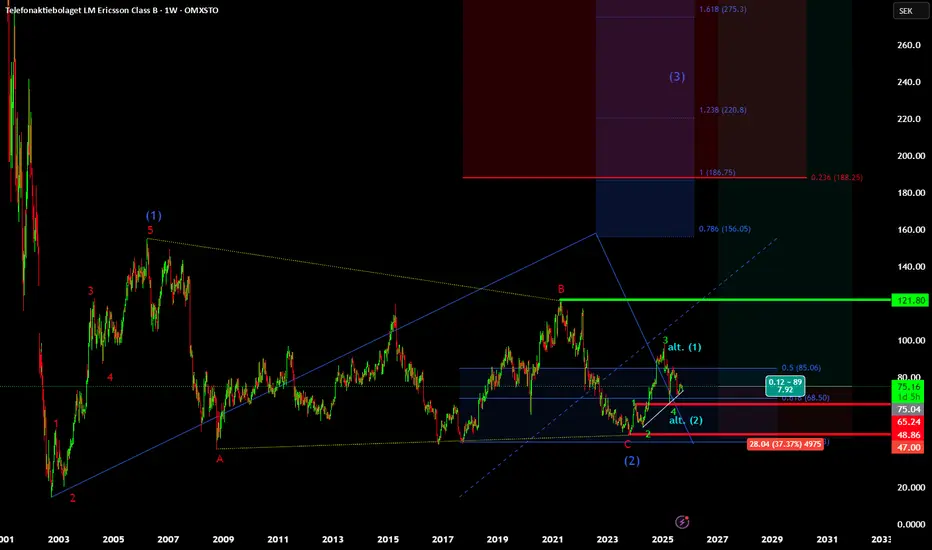
Yes, Ericsson has been facing a long period of challenges but I believe that the future is bright for the company at least based on the chart I see. Some fundamental data looks fairly good as well e.g. EPS, book value, dividends meanwhile debt is predicted to rise, CAPEX too ... just some numbers for background information.
The chart however, is rather beautiful if you ask me. Clearly an impulse for the (blue 1) followed by many overlapping waves indicating corrective price action.
Lately, we have gotten 3 higher lows, bounce of trend line and nice reactions to important fib levels.
I predict at least 10-20% upside in the near future and if we are extremely lucky over the next years we might see up to 300-400% increase which is the moderate target assuming that the move to the upside is only corrective.
Stop loss = 65.44
The chart however, is rather beautiful if you ask me. Clearly an impulse for the (blue 1) followed by many overlapping waves indicating corrective price action.
Lately, we have gotten 3 higher lows, bounce of trend line and nice reactions to important fib levels.
I predict at least 10-20% upside in the near future and if we are extremely lucky over the next years we might see up to 300-400% increase which is the moderate target assuming that the move to the upside is only corrective.
Stop loss = 65.44

면책사항
해당 정보와 게시물은 금융, 투자, 트레이딩 또는 기타 유형의 조언이나 권장 사항으로 간주되지 않으며, 트레이딩뷰에서 제공하거나 보증하는 것이 아닙니다. 자세한 내용은 이용 약관을 참조하세요.
면책사항
해당 정보와 게시물은 금융, 투자, 트레이딩 또는 기타 유형의 조언이나 권장 사항으로 간주되지 않으며, 트레이딩뷰에서 제공하거나 보증하는 것이 아닙니다. 자세한 내용은 이용 약관을 참조하세요.