
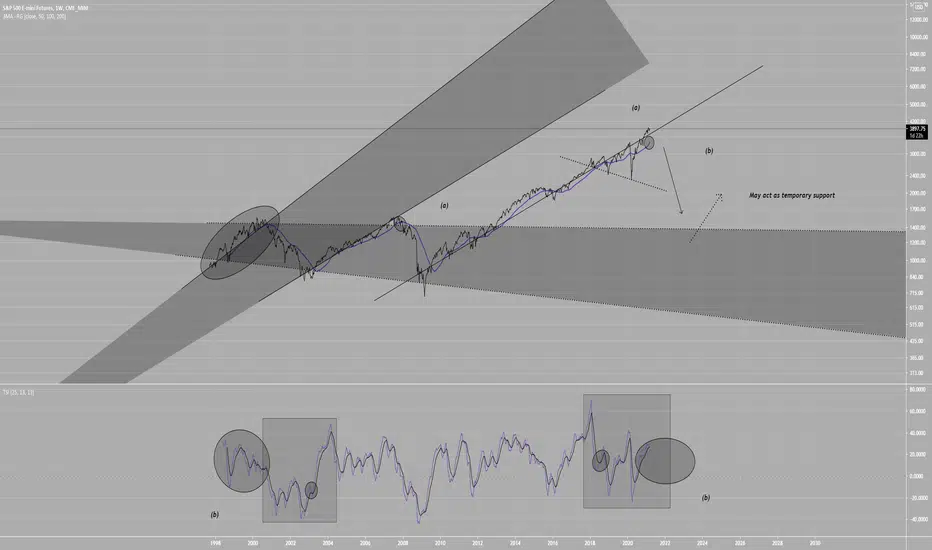
(a) is the 50MA, it can be seen to be curling upwards
and the comparison point (a) shows this ends in a bearish outcome
(b) is a similar points on TSI where I expect a reoccurrence of the pattern in oval to occur, likely acting bearishly.
As i have said before, assess the situation based on impact
2008 banking crisis the market collapsed
2020 COVID? Upward movement seems unjustified.
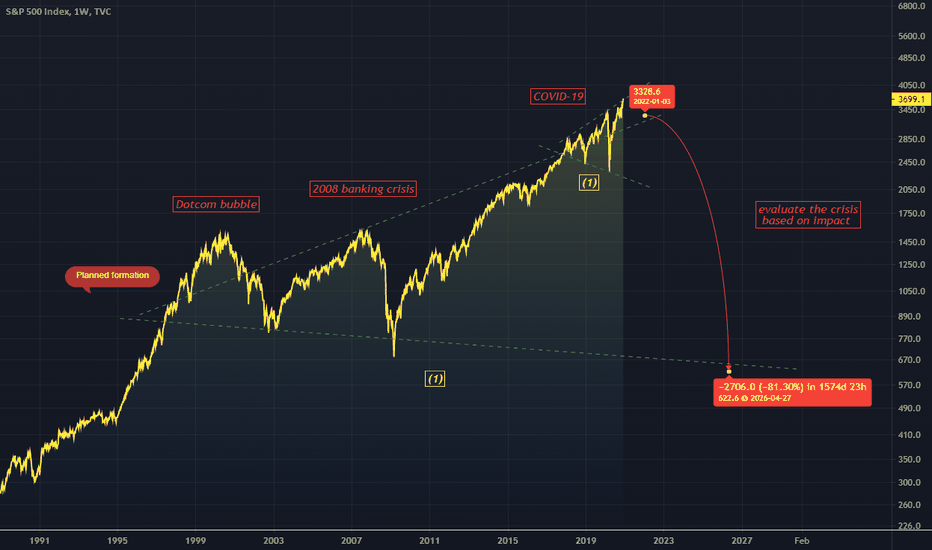
Here is a chart that further explains that philosophy.
I know the charts are kinda similar but I wanted to restate this for those unaware..
and the comparison point (a) shows this ends in a bearish outcome
(b) is a similar points on TSI where I expect a reoccurrence of the pattern in oval to occur, likely acting bearishly.
As i have said before, assess the situation based on impact
2008 banking crisis the market collapsed
2020 COVID? Upward movement seems unjustified.
Here is a chart that further explains that philosophy.
I know the charts are kinda similar but I wanted to restate this for those unaware..

면책사항
해당 정보와 게시물은 금융, 투자, 트레이딩 또는 기타 유형의 조언이나 권장 사항으로 간주되지 않으며, 트레이딩뷰에서 제공하거나 보증하는 것이 아닙니다. 자세한 내용은 이용 약관을 참조하세요.
면책사항
해당 정보와 게시물은 금융, 투자, 트레이딩 또는 기타 유형의 조언이나 권장 사항으로 간주되지 않으며, 트레이딩뷰에서 제공하거나 보증하는 것이 아닙니다. 자세한 내용은 이용 약관을 참조하세요.