
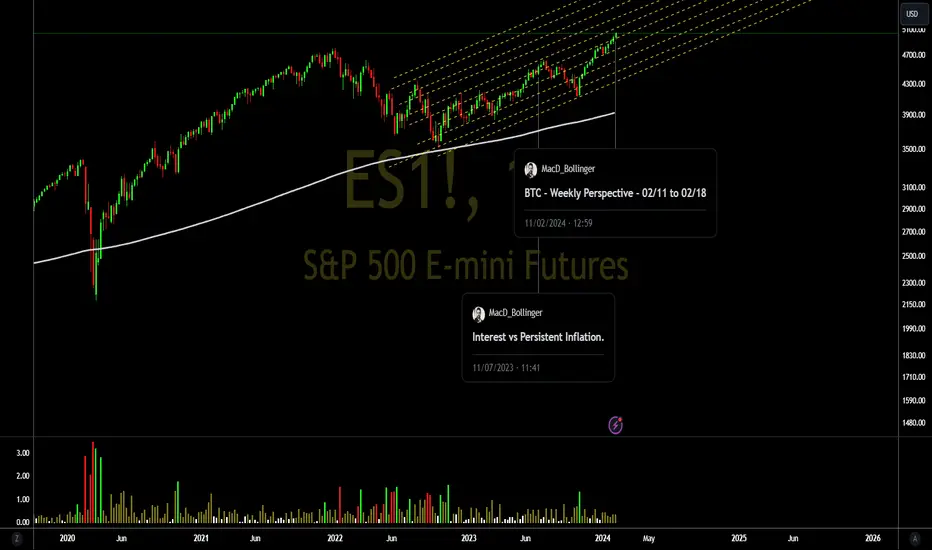
Considering the projection outlined for the future SPX in a previous analysis, I realize that the target pointed out by SETUP on the long-term chart has been reached.
Therefore, I think we have nowhere else to go up without at least having a small correction towards the 4685 region if I only consider the graphical analysis. See the image below.

Despite "reaching" the target, SETUP still shows that the index has a small strength to surpass this mark and reach the 5058 region, which can be seen as a buying trap for the most unsuspecting trader.
Coming to the short-term chart, the SETUP used indicates that we are in an extremely overbought region, therefore, it shows that the index is losing strength and that it really needs to make a correction. See below.

Do your analysis and it's good business.
Be aware, if you buy, use stop loss!
See other graphical analyzes below.
Therefore, I think we have nowhere else to go up without at least having a small correction towards the 4685 region if I only consider the graphical analysis. See the image below.
Despite "reaching" the target, SETUP still shows that the index has a small strength to surpass this mark and reach the 5058 region, which can be seen as a buying trap for the most unsuspecting trader.
Coming to the short-term chart, the SETUP used indicates that we are in an extremely overbought region, therefore, it shows that the index is losing strength and that it really needs to make a correction. See below.
Do your analysis and it's good business.
Be aware, if you buy, use stop loss!
See other graphical analyzes below.

관련 발행물
면책사항
해당 정보와 게시물은 금융, 투자, 트레이딩 또는 기타 유형의 조언이나 권장 사항으로 간주되지 않으며, 트레이딩뷰에서 제공하거나 보증하는 것이 아닙니다. 자세한 내용은 이용 약관을 참조하세요.
면책사항
해당 정보와 게시물은 금융, 투자, 트레이딩 또는 기타 유형의 조언이나 권장 사항으로 간주되지 않으며, 트레이딩뷰에서 제공하거나 보증하는 것이 아닙니다. 자세한 내용은 이용 약관을 참조하세요.