
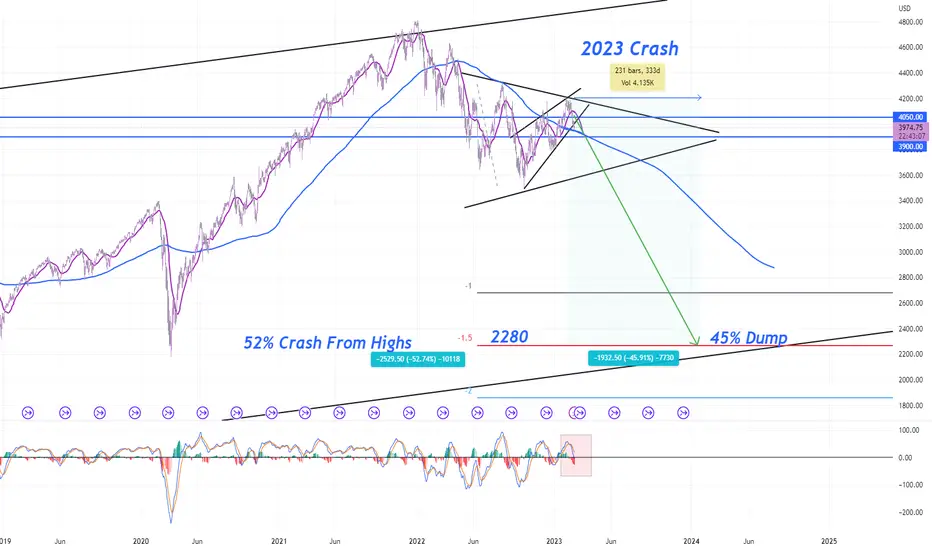
I will reference the 1973 crash as proof that this is what is happening today.
Similarities:
8% between the 200sma and the all time High
Daily Pennant/ Triangle Formation
Bear Market Rally breaking above the 200sma, formed a double top
45% crash in prices in 232 trading days
50% crash from all time highs
1973 went 3 full range expansions
2023 potentially go to 1.5 full range expansions
Both years ending in 3
MACD above the zero line, bearish cross and rolled over
I will ride it down to 2280 and then accumulate SPY at 230
Massive wealth will be available to those who take it
Here is the chart of November 1973 and how they are IDENTICAL to today

관련 발행물
면책사항
해당 정보와 게시물은 금융, 투자, 트레이딩 또는 기타 유형의 조언이나 권장 사항으로 간주되지 않으며, 트레이딩뷰에서 제공하거나 보증하는 것이 아닙니다. 자세한 내용은 이용 약관을 참조하세요.
관련 발행물
면책사항
해당 정보와 게시물은 금융, 투자, 트레이딩 또는 기타 유형의 조언이나 권장 사항으로 간주되지 않으며, 트레이딩뷰에서 제공하거나 보증하는 것이 아닙니다. 자세한 내용은 이용 약관을 참조하세요.