
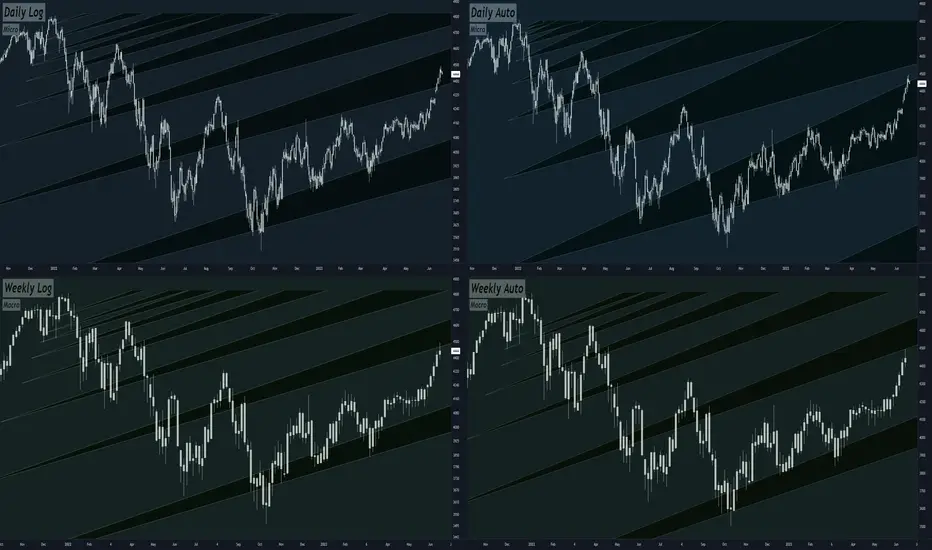
-Here's my quad chart analysis of ES1!, the S&P500 futures index, displaying striking accuracy with Fibonacci retracements.
-The top two boxes present micro charts on daily tf's, showing recent Fibonacci-based peaks and troughs. The bottom two are weekly schematics on 3 Day tf's, revealing longer-term trends obediently following Fib levels.
-KEEP IN MIND THE BOTTOM TWO "WEEKLY" ARE ACTUALLY 3 DAY CHARTS MAPPING A WEEKLY SCHEMATIC
-This alignment suggests the Market Maker's playful maneuvers before an anticipated significant move. Based on the patterns, I hypothesize a considerable downtrend on the horizon for the S&P Futures Index (ES1!).
-Remember, market predictions aren't set in stone and require vigilance. However... dump city here we come.
-The top two boxes present micro charts on daily tf's, showing recent Fibonacci-based peaks and troughs. The bottom two are weekly schematics on 3 Day tf's, revealing longer-term trends obediently following Fib levels.
-KEEP IN MIND THE BOTTOM TWO "WEEKLY" ARE ACTUALLY 3 DAY CHARTS MAPPING A WEEKLY SCHEMATIC
-This alignment suggests the Market Maker's playful maneuvers before an anticipated significant move. Based on the patterns, I hypothesize a considerable downtrend on the horizon for the S&P Futures Index (ES1!).
-Remember, market predictions aren't set in stone and require vigilance. However... dump city here we come.
노트
노트

관련 발행물
면책사항
해당 정보와 게시물은 금융, 투자, 트레이딩 또는 기타 유형의 조언이나 권장 사항으로 간주되지 않으며, 트레이딩뷰에서 제공하거나 보증하는 것이 아닙니다. 자세한 내용은 이용 약관을 참조하세요.
관련 발행물
면책사항
해당 정보와 게시물은 금융, 투자, 트레이딩 또는 기타 유형의 조언이나 권장 사항으로 간주되지 않으며, 트레이딩뷰에서 제공하거나 보증하는 것이 아닙니다. 자세한 내용은 이용 약관을 참조하세요.