
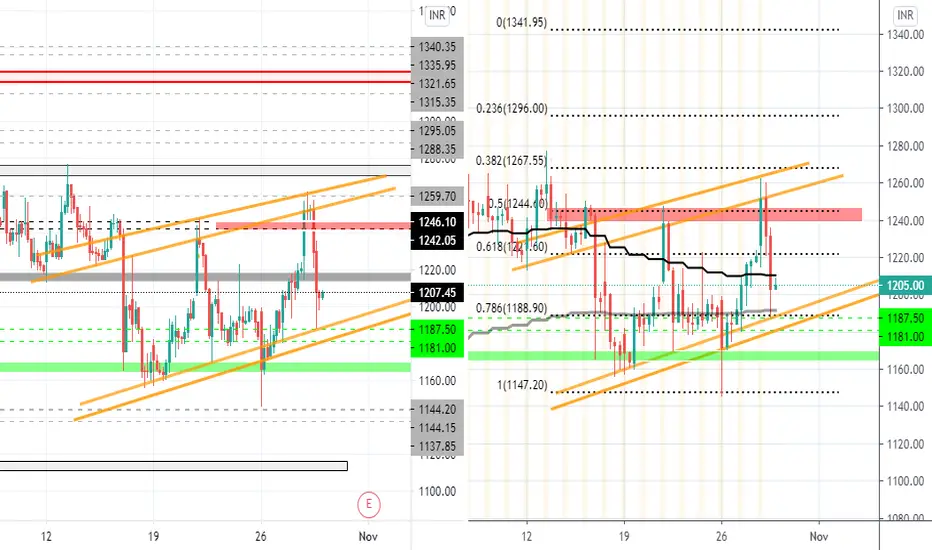
ALL THE LEVELS ARE MARKED ON CHART;
STOCK MIGHT FACE RESISTANCE NEAR 1220 PRICE FROM DAILY 20 EMA AND FIB LEVEL. SELL NEAR IT IF REVERSAL CANDLES ARE FORMED NEARBY IF FORMED NEARBY THE RED ZONE
BUY NEAR 1165-1175 LEVEL
The indicator used:
1) Daily Lines plots Daily 20 EMA on lower time frame charts
If you like the analysis, do leave a like and follow for more such content coming up.
The analysis is my POV, hope you got bucks in your pocket to consult a financial advisor before investing :P :)
HAPPY TRADING!!
STOCK MIGHT FACE RESISTANCE NEAR 1220 PRICE FROM DAILY 20 EMA AND FIB LEVEL. SELL NEAR IT IF REVERSAL CANDLES ARE FORMED NEARBY IF FORMED NEARBY THE RED ZONE
BUY NEAR 1165-1175 LEVEL
The indicator used:
1) Daily Lines plots Daily 20 EMA on lower time frame charts
If you like the analysis, do leave a like and follow for more such content coming up.
The analysis is my POV, hope you got bucks in your pocket to consult a financial advisor before investing :P :)
HAPPY TRADING!!

관련 발행물
면책사항
해당 정보와 게시물은 금융, 투자, 트레이딩 또는 기타 유형의 조언이나 권장 사항으로 간주되지 않으며, 트레이딩뷰에서 제공하거나 보증하는 것이 아닙니다. 자세한 내용은 이용 약관을 참조하세요.
면책사항
해당 정보와 게시물은 금융, 투자, 트레이딩 또는 기타 유형의 조언이나 권장 사항으로 간주되지 않으며, 트레이딩뷰에서 제공하거나 보증하는 것이 아닙니다. 자세한 내용은 이용 약관을 참조하세요.