
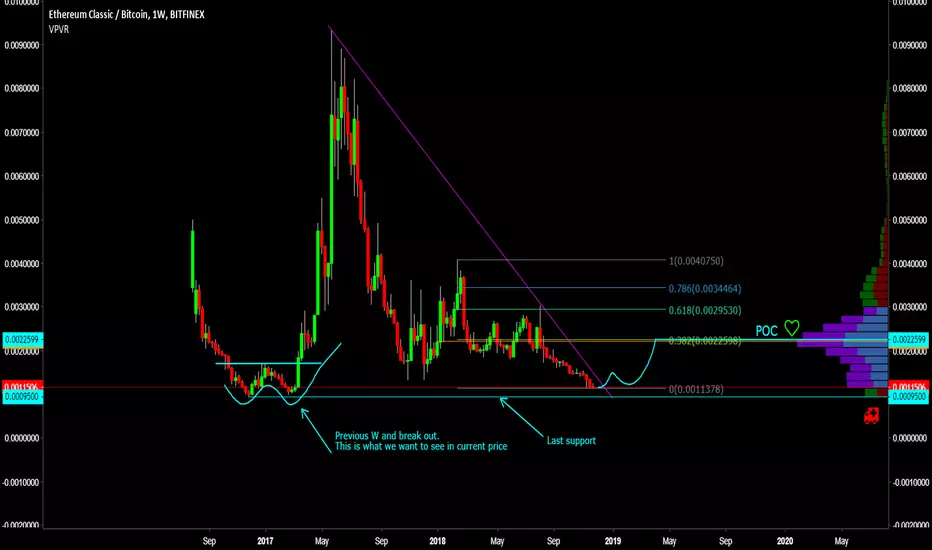
Looking at ETCBTC on a WEEKLY chart.
Rsi oversold
W%R oversold
Bullish divergence on histogram (potential not yet confirmed)
OBV looking ok but would like to see a W or some structure
Looking good to take profits at the POC
Volume profile looking close to full
There are many gaps on the way up that need to be filled
If you want to live life on the edge bids can be set at last support (9500 sats) where i think the bulls will defend this level.
Essentially we want to see price structure ("W"s) and indicator confirmation to know we have a floor, like the previous "W"
This will definitely be on my watch list as it has many fundamental drivers pushing it not to mention a potentially good looking chart.
Don't forget to hit the like button or follow me on Trading View for more chart analysis :)
Rsi oversold
W%R oversold
Bullish divergence on histogram (potential not yet confirmed)
OBV looking ok but would like to see a W or some structure
Looking good to take profits at the POC
Volume profile looking close to full
There are many gaps on the way up that need to be filled
If you want to live life on the edge bids can be set at last support (9500 sats) where i think the bulls will defend this level.
Essentially we want to see price structure ("W"s) and indicator confirmation to know we have a floor, like the previous "W"
This will definitely be on my watch list as it has many fundamental drivers pushing it not to mention a potentially good looking chart.
Don't forget to hit the like button or follow me on Trading View for more chart analysis :)

면책사항
해당 정보와 게시물은 금융, 투자, 트레이딩 또는 기타 유형의 조언이나 권장 사항으로 간주되지 않으며, 트레이딩뷰에서 제공하거나 보증하는 것이 아닙니다. 자세한 내용은 이용 약관을 참조하세요.
면책사항
해당 정보와 게시물은 금융, 투자, 트레이딩 또는 기타 유형의 조언이나 권장 사항으로 간주되지 않으며, 트레이딩뷰에서 제공하거나 보증하는 것이 아닙니다. 자세한 내용은 이용 약관을 참조하세요.