
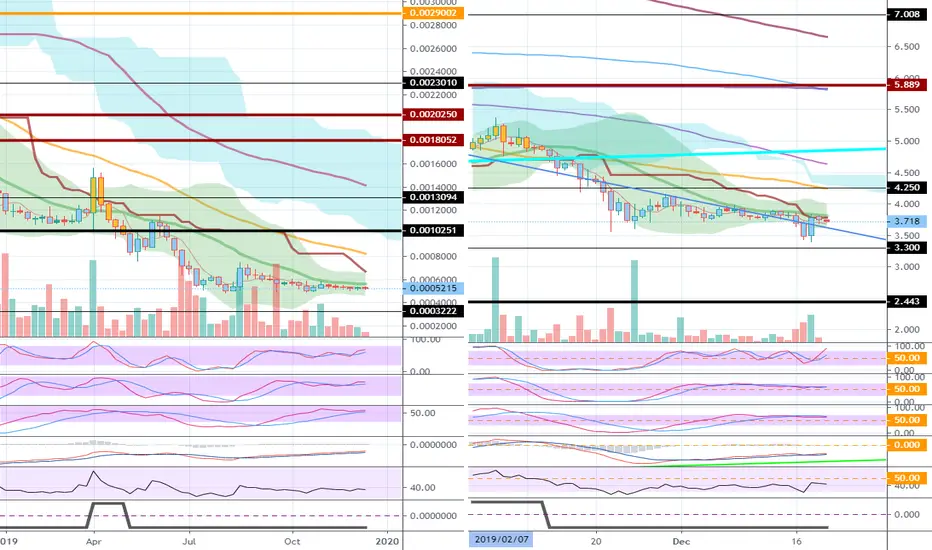
On the ETCBTC chart,
Below 0.0010251 is a long-term investment area.
In the ETCUSD chart,
It is moving around the downtrend line.
You should check if you can move outside of the downward trend line.
----------------
It is expected to take a long time to raise prices in the normal market flow.
Below 0.0010251 is a long-term investment area.
In the ETCUSD chart,
It is moving around the downtrend line.
You should check if you can move outside of the downward trend line.
----------------
It is expected to take a long time to raise prices in the normal market flow.

[Practical trading strategy using HA-MS and SBOD]
youtu.be/aceN1AttX1Y
youtu.be/aceN1AttX1Y
관련 발행물
면책사항
해당 정보와 게시물은 금융, 투자, 트레이딩 또는 기타 유형의 조언이나 권장 사항으로 간주되지 않으며, 트레이딩뷰에서 제공하거나 보증하는 것이 아닙니다. 자세한 내용은 이용 약관을 참조하세요.
[Practical trading strategy using HA-MS and SBOD]
youtu.be/aceN1AttX1Y
youtu.be/aceN1AttX1Y
관련 발행물
면책사항
해당 정보와 게시물은 금융, 투자, 트레이딩 또는 기타 유형의 조언이나 권장 사항으로 간주되지 않으며, 트레이딩뷰에서 제공하거나 보증하는 것이 아닙니다. 자세한 내용은 이용 약관을 참조하세요.