
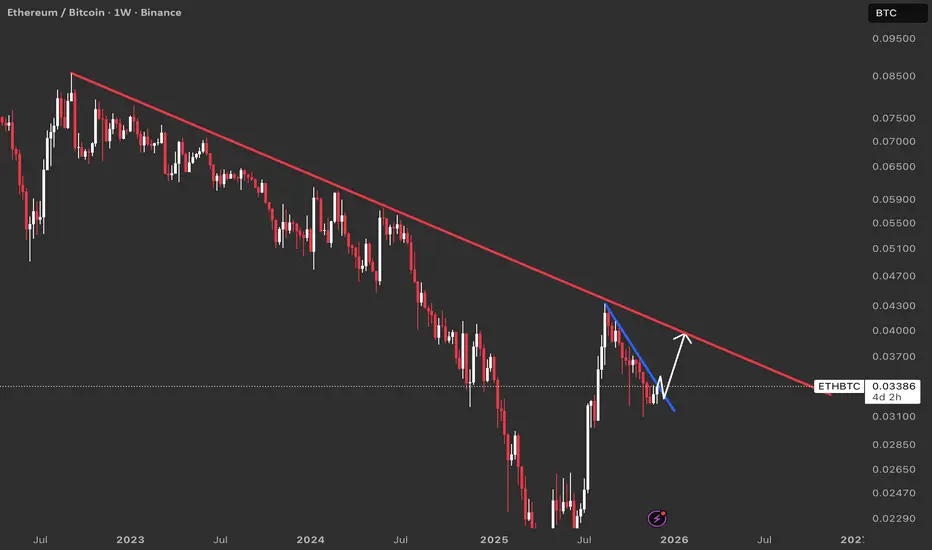
This weekly chart maps ETH performance relative to Bitcoin over the last few years and highlights a long, persistent downtrend. The red line captures the major descending resistance that has capped every significant ETHBTC rally since 2022, while the blue line marks the latest corrective downswing inside that broader structure.
The recent move forms a series of lower highs and lower lows against Bitcoin, compressed under the blue trend line. If price breaks and closes above this blue line, it would signal that the current micro downtrend is over and that ETH is starting a new leg of outperformance versus Bitcoin.
Such a breakout often acts as confirmation that capital is rotating back into ETH, favoring ETH‑heavy allocations.
Above, the red trend line remains the key macro resistance and a logical first upside objective for any ETHBTC recovery. This line has rejected multiple rallies in the past, so even if price breaks the blue trend line and accelerates higher, the red line is where many traders will look to take profits or at least tighten stops, expecting potential rejection.
The recent move forms a series of lower highs and lower lows against Bitcoin, compressed under the blue trend line. If price breaks and closes above this blue line, it would signal that the current micro downtrend is over and that ETH is starting a new leg of outperformance versus Bitcoin.
Such a breakout often acts as confirmation that capital is rotating back into ETH, favoring ETH‑heavy allocations.
Above, the red trend line remains the key macro resistance and a logical first upside objective for any ETHBTC recovery. This line has rejected multiple rallies in the past, so even if price breaks the blue trend line and accelerates higher, the red line is where many traders will look to take profits or at least tighten stops, expecting potential rejection.

면책사항
해당 정보와 게시물은 금융, 투자, 트레이딩 또는 기타 유형의 조언이나 권장 사항으로 간주되지 않으며, 트레이딩뷰에서 제공하거나 보증하는 것이 아닙니다. 자세한 내용은 이용 약관을 참조하세요.
면책사항
해당 정보와 게시물은 금융, 투자, 트레이딩 또는 기타 유형의 조언이나 권장 사항으로 간주되지 않으며, 트레이딩뷰에서 제공하거나 보증하는 것이 아닙니다. 자세한 내용은 이용 약관을 참조하세요.