
Whats up traders,
Here we have ETH/BTC on the 1H chart.
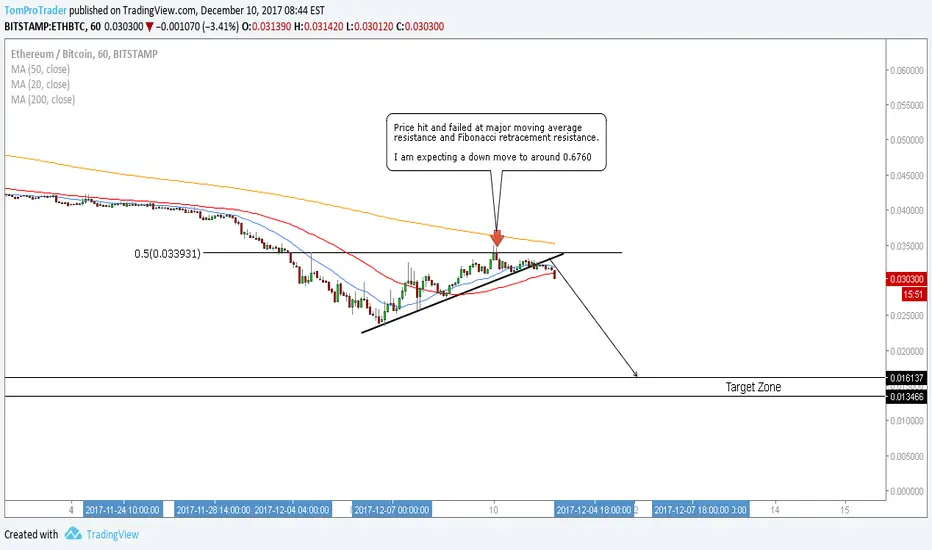
Price recently had a down impulse leg, followed by a corrective leg. The corrective leg recently stalled at 0.5 Fibonacci retracement resistance, and price has since made lower lows.
Price was correcting in a support channel structure, however the structure has recently broken and price began showing reversal candlesticks, implying a breakdown of price.
Price used 20 moving average as resistance, showing that even if the down move is intermediate (Since the 20 moving average is the smallest) it will be enough to break structure, ride the dollar dysfunction, and still deliver a profit anyway.
I am now expecting a down move in this pair to the target outlined on my chart at 0.016000.
I will update this analysis as the trade plays out.
Here we have ETH/BTC on the 1H chart.
Price recently had a down impulse leg, followed by a corrective leg. The corrective leg recently stalled at 0.5 Fibonacci retracement resistance, and price has since made lower lows.
Price was correcting in a support channel structure, however the structure has recently broken and price began showing reversal candlesticks, implying a breakdown of price.
Price used 20 moving average as resistance, showing that even if the down move is intermediate (Since the 20 moving average is the smallest) it will be enough to break structure, ride the dollar dysfunction, and still deliver a profit anyway.
I am now expecting a down move in this pair to the target outlined on my chart at 0.016000.
I will update this analysis as the trade plays out.

관련 발행물
면책사항
해당 정보와 게시물은 금융, 투자, 트레이딩 또는 기타 유형의 조언이나 권장 사항으로 간주되지 않으며, 트레이딩뷰에서 제공하거나 보증하는 것이 아닙니다. 자세한 내용은 이용 약관을 참조하세요.
면책사항
해당 정보와 게시물은 금융, 투자, 트레이딩 또는 기타 유형의 조언이나 권장 사항으로 간주되지 않으며, 트레이딩뷰에서 제공하거나 보증하는 것이 아닙니다. 자세한 내용은 이용 약관을 참조하세요.