ETH - Range analys - update
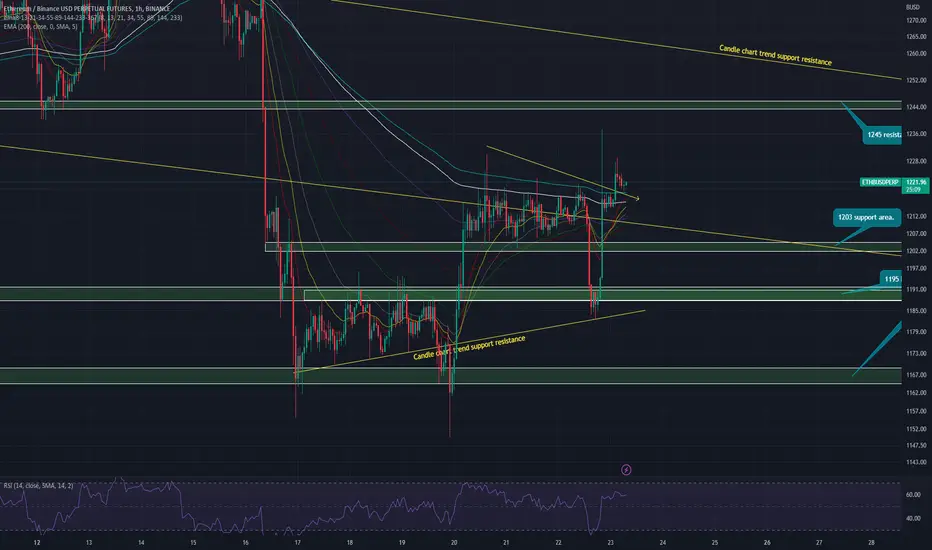
Disclaimer: If you think this chart is a mess, you are wrong. Here, we are dealing with lots of fibonacci lines to find confluence at specific zones we want to trade. As we want to maximize our profits, we want to trade at highest possible risk reward ratio. As this is a game of possibilities, our job is to find specific zone with highets probability to make price reaction.
As you can see our 1195 local support was valid and price reacted with a huge spike. What caused that spike? Well..we can only discuss about it. First of all, look at the point where price bounced - right on the yellow line. Coincidence? I dont belive in coincidence in trading. Huge spike? Yellow arrow of liqudity pushing price down, late shorters coming in during that big red candle, bouncing from yellow support trend line and pushing price in other direction to collect liqudity above yellow arrow. There is never only one scenario possible...be ready for all of them :)
Tools:
- Fibonacci retreacement
- Fibonacci extension
- Pitchfork (All types)
- Trend lines
- RSI
- EMA fibonacci numbers
**If you take closer look, you can see how price respects the lines. If the trade analys is good, we can find a place where the top/bottom of the wick will happen, therefore place an entry buy/sell order and let the magic happen :)

관련 발행물
면책사항
해당 정보와 게시물은 금융, 투자, 트레이딩 또는 기타 유형의 조언이나 권장 사항으로 간주되지 않으며, 트레이딩뷰에서 제공하거나 보증하는 것이 아닙니다. 자세한 내용은 이용 약관을 참조하세요.
면책사항
해당 정보와 게시물은 금융, 투자, 트레이딩 또는 기타 유형의 조언이나 권장 사항으로 간주되지 않으며, 트레이딩뷰에서 제공하거나 보증하는 것이 아닙니다. 자세한 내용은 이용 약관을 참조하세요.