
Hello traders,
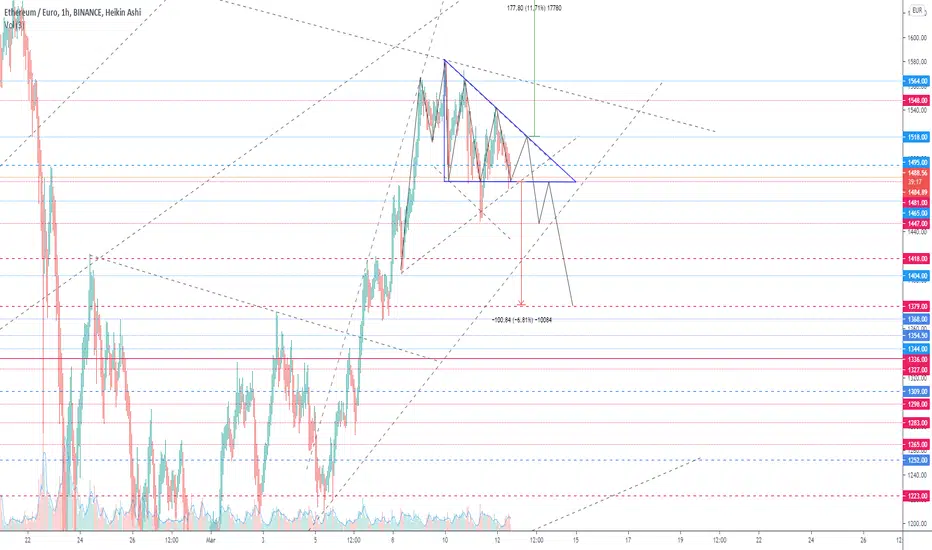
Two triangles have been forming recently: the first one since March 8th around 1400 EUR, and the second one since March 9. The former is a symmetrical triangle, while the latter is a flat bottom triangle. As chart displays, the former is not that clear, while the flat bottomed (drawn in blue) is more evident.
In terms of pricing, considering the height of this flat-bottomed triangle, prices could potentially dip up to 1380 EUR, which coincides with the resistance configured by the inverted head & shoulders pattern, formed and fulfilled on late February. However, one should also consider 1420 EUR as a consolidated resistance in the case the pattern that goes from February 23 to March 05 is a flat top triangle.
If you find this analysis useful, please like, comment, or donate
Two triangles have been forming recently: the first one since March 8th around 1400 EUR, and the second one since March 9. The former is a symmetrical triangle, while the latter is a flat bottom triangle. As chart displays, the former is not that clear, while the flat bottomed (drawn in blue) is more evident.
In terms of pricing, considering the height of this flat-bottomed triangle, prices could potentially dip up to 1380 EUR, which coincides with the resistance configured by the inverted head & shoulders pattern, formed and fulfilled on late February. However, one should also consider 1420 EUR as a consolidated resistance in the case the pattern that goes from February 23 to March 05 is a flat top triangle.
If you find this analysis useful, please like, comment, or donate

면책사항
해당 정보와 게시물은 금융, 투자, 트레이딩 또는 기타 유형의 조언이나 권장 사항으로 간주되지 않으며, 트레이딩뷰에서 제공하거나 보증하는 것이 아닙니다. 자세한 내용은 이용 약관을 참조하세요.
면책사항
해당 정보와 게시물은 금융, 투자, 트레이딩 또는 기타 유형의 조언이나 권장 사항으로 간주되지 않으며, 트레이딩뷰에서 제공하거나 보증하는 것이 아닙니다. 자세한 내용은 이용 약관을 참조하세요.