
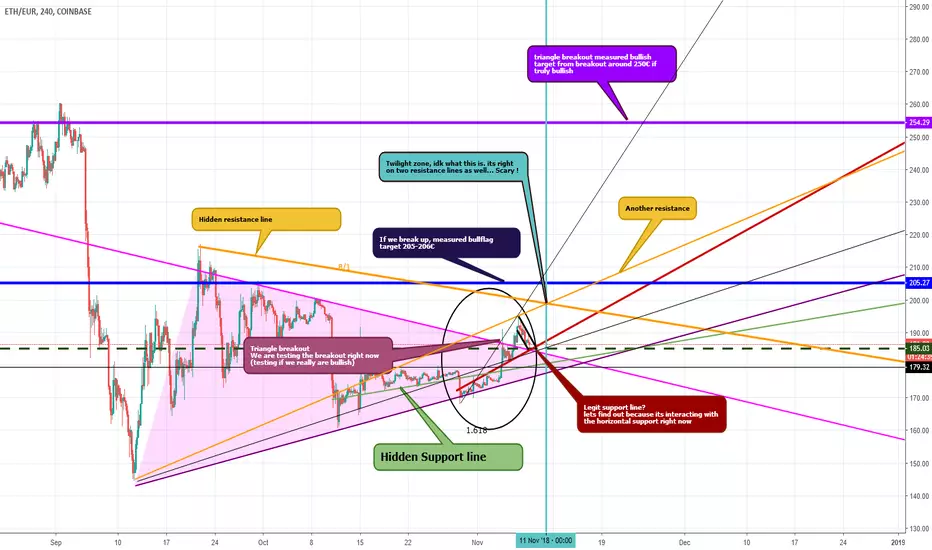
Current thoughts !
To much info to put on a screenshot on my current chart, so im just throwing this out here.
Not the prettiest but it shows some interesting
stuff perhaps ...
Also includes my high oscillation area from my previous chart - ze twilight zone :D
To much info to put on a screenshot on my current chart, so im just throwing this out here.
Not the prettiest but it shows some interesting
stuff perhaps ...
Also includes my high oscillation area from my previous chart - ze twilight zone :D
거래청산: 스탑 닿음
I got stopped out with with small profit. Lets see what happens with ETH...Revaluating.
노트
Clear testing of the triangle breakout right now I might have been stopped out to early, lets see what happens노트
노트
ProjectionBased of Trend, Resistance & support
노트
We keep on setting higher lows, have a feeling we could take off a bit more soon then move sideways a lot longer... a big move should happens soon enough(in either direction) tho im leaning bullish still.노트
Buying back in with a SL just below 180€.
ETH is sneakily bullish but my assessment is that we might have limited upside. Still same targets, 205-210€
노트
Are we bulls fools?Upside potential outweighing downside on this. Heavy bounce of sloping downtrendline. Might indicate higher probability for the upside break imo.
노트
I see inverse head and shoulders and a test of the 200 resistance as next move노트
Welcome to the Twilight Zone :)
면책사항
해당 정보와 게시물은 금융, 투자, 트레이딩 또는 기타 유형의 조언이나 권장 사항으로 간주되지 않으며, 트레이딩뷰에서 제공하거나 보증하는 것이 아닙니다. 자세한 내용은 이용 약관을 참조하세요.
면책사항
해당 정보와 게시물은 금융, 투자, 트레이딩 또는 기타 유형의 조언이나 권장 사항으로 간주되지 않으며, 트레이딩뷰에서 제공하거나 보증하는 것이 아닙니다. 자세한 내용은 이용 약관을 참조하세요.